This page provides an overview of what you can do with the Amazon CloudFront integration. The documentation pages only for a limited number of integrations contain the setup steps and instructions. If you do not see the setup steps here, navigate to the Operations for Applications GUI. The detailed instructions for setting up and configuring all integrations, including the Amazon CloudFront integration are on the Setup tab of the integration.
- Log in to your Operations for Applications instance.
- Click Integrations on the toolbar, search for and click the Amazon CloudFront tile.
- Click the Setup tab and you will see the most recent and up-to-date instructions.
Amazon Web Services Integration
The Amazon Web Services integration is full-featured implementation offering pre-defined dashboards and alert conditions and is fully configurable.
Dashboards
Operations for Applications provides Amazon Web Services overview dashboards Summary, Pricing, and Billing and the service-specific dashboards for the following products:
- AWS: ALB
- AWS: API Gateway
- AWS: Auto Scaling
- AWS: CloudFront
- AWS: Cloud Search
- AWS: CloudTrail
- AWS: DMS
- AWS: Direct Connect
- AWS: DynamoDB
- AWS: EBS
- AWS: EC2
- AWS: ECS (cAdvisor)
- AWS: ECS
- AWS: ECS (Fargate)
- AWS: EFS
- AWS: ELB
- AWS: EMR
- AWS: Elastic Beanstalk
- AWS: ElastiCache
- AWS: Elasticsearch
- AWS: Elastic Transcoder
- AWS: FSx
- AWS: IoT Core
- AWS: IAM Access Key Age
- AWS: Kinesis Data Stream
- AWS: Kinesis Firehose
- AWS: KMS
- AWS: Lambda
- AWS: OpsWorks
- AWS: RDS
- AWS: Redshift
- AWS: Route53
- AWS: S3
- AWS: SNS
- AWS: SQS
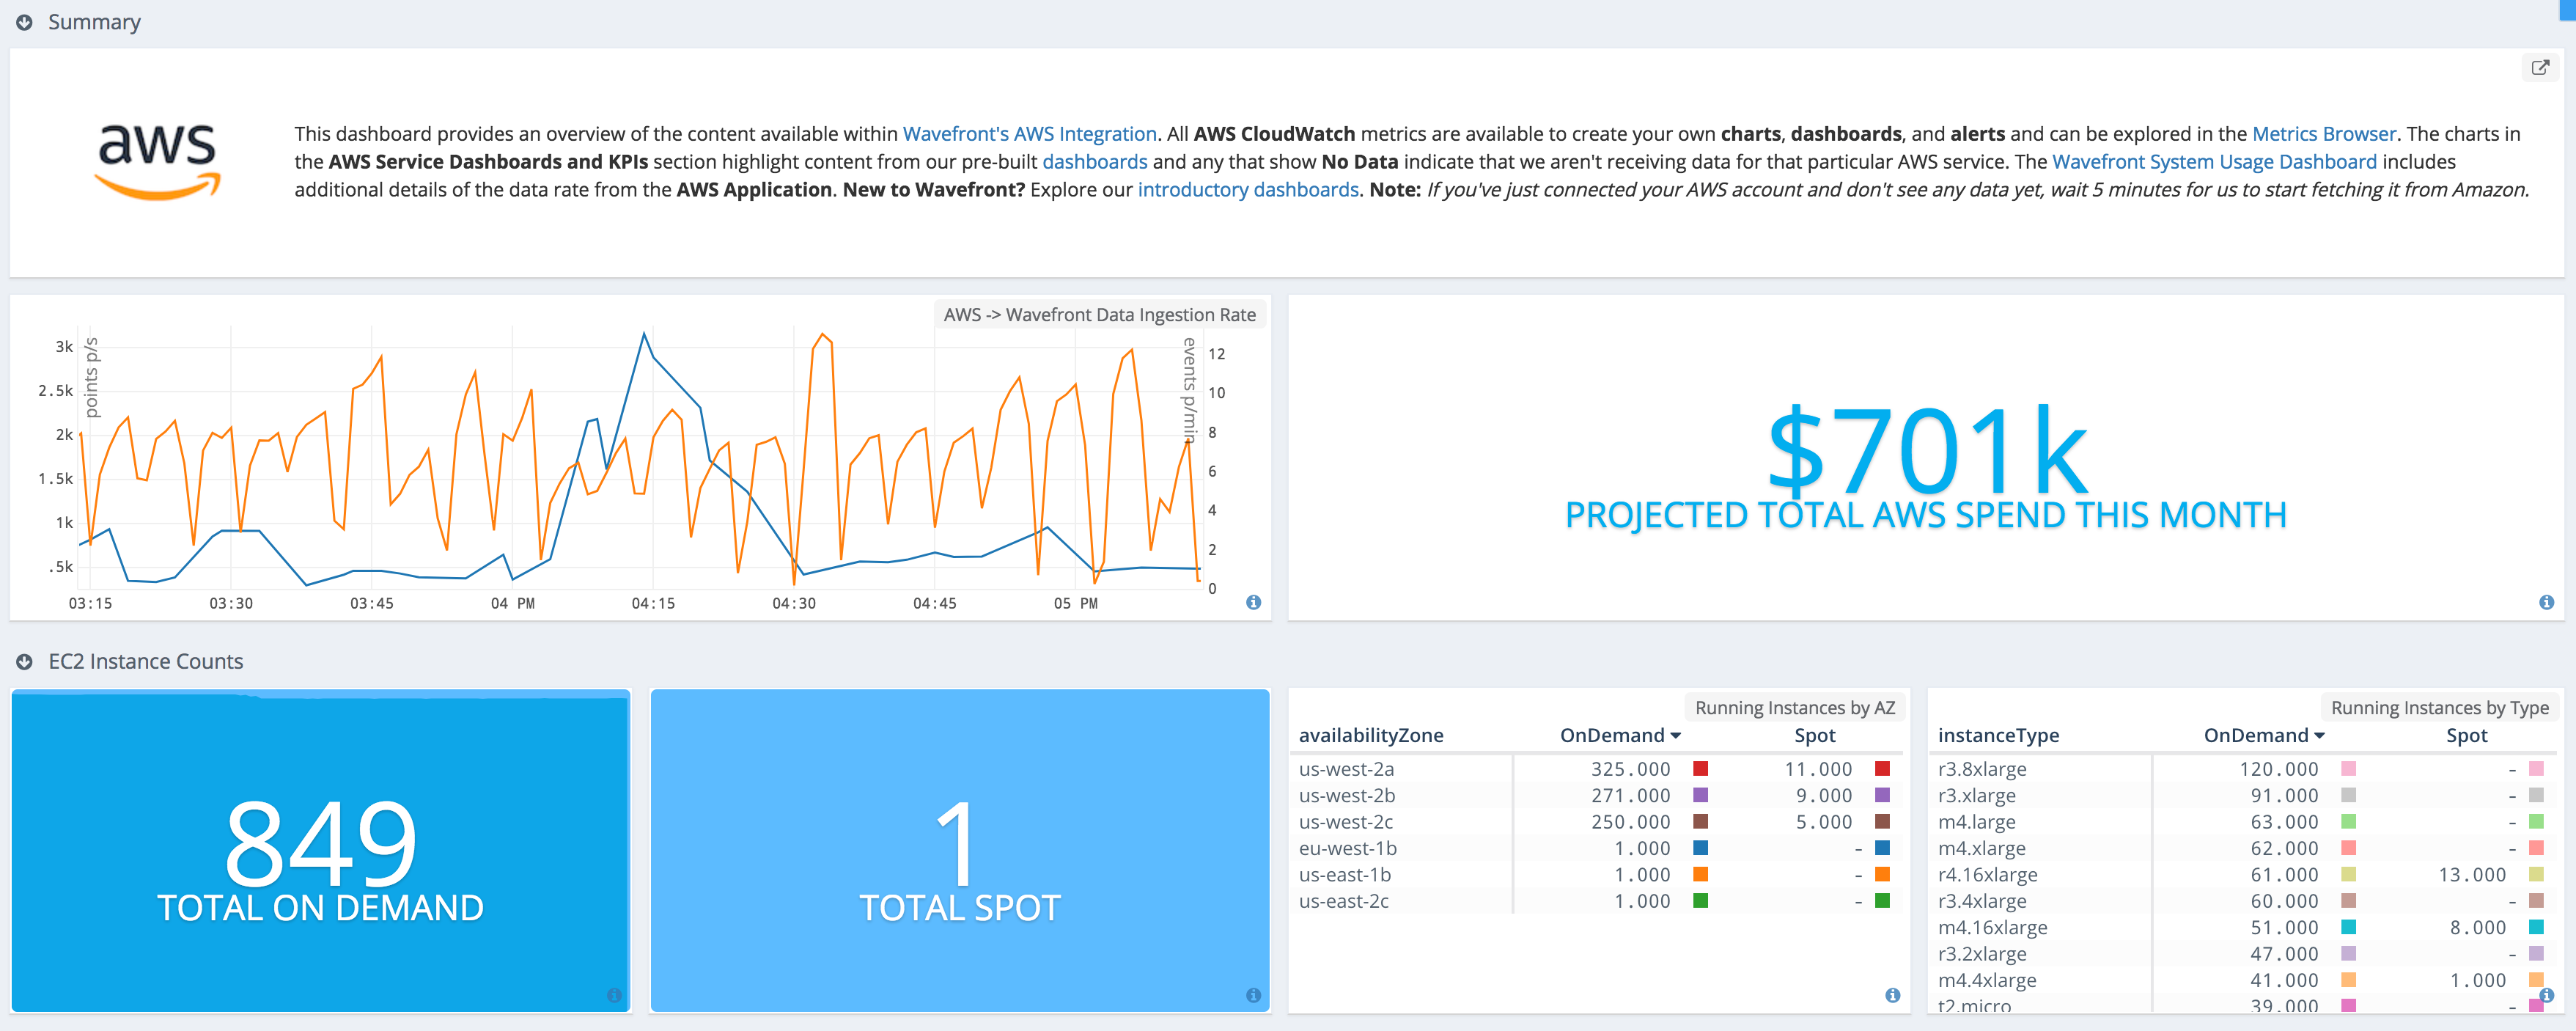
Summary Dashboard
From the Summary dashboard you can easily navigate to all other AWS dashboards.

Alerts
The Amazon Web Services integration dashboards contains pre-defined alert conditions embedded as queries in charts contained in the dashboards. For example:

To create the alert, click the Create Alert link under the query and configure the alert properties (notification targets, condition checking frequency, etc.).
Metrics Configuration
Operations for Applications ingests Amazon Web Services metrics using the CloudWatch, CloudTrail, and AWS service APIs. For details on the metrics and how to configure ingestion, see AWS Metrics Integration.
Metrics Information
You can see the information about the metrics and dimensions which are published to CloudWatch via different AWS services on the AWS CloudWatch metrics doc site. Click a link below to see the detailed metrics information per service:
- AWS EC2
- AWS S3
- AWS SQS
- AWS EBS
- AWS ECS
- AWS ELB
- AWS SNS
- AWS DMS
- AWS Lambda
- AWS Redshift
- AWS Auto Scaling
- AWS API Gateway
- AWS Kinesis Firehose
- AWS DynamoDB
Add an Amazon Cloud Integration
Setting up an Amazon cloud integration requires establishing a trust relationship between Amazon and VMware Aria Operations for Applications.
You start by granting Operations for Applications read-only access to your Amazon account or by giving limited access.
Then, you register the integration by providing the necessary information. See AWS Integration Overview for information about setting up and managing the AWS Cloud integration.
Set Up AWS CloudWatch Logs
You can use an AWS Lambda function to ingest CloudWatch logs to Operations for Applications. CloudWatch provides data and actionable insights to monitor your applications and respond to system-wide performance changes. It also helps you optimize resource utilization and get a unified view of operational health. CloudWatch collects monitoring and operational data in the form of logs, metrics, and events, providing a unified view of AWS resources, applications, and services that run on AWS and on-premises servers. You can use CloudWatch to detect anomalous behavior in your environments, set alarms, visualize logs and metrics side by side, take automated actions, troubleshoot issues, and discover insights to keep applications running smoothly. To understand more about CloudWatch, see the Amazon CloudWatch documentation.
Install the Wavefront Proxy
The Wavefront proxy is required to send logs from your systems to Operations for Applications. If you have not already done so, install a Wavefront proxy in your AWS environment.
Create an AWS Lambda Function
- Log in to the AWS Management Console, search for Lambda, and select it.
- Click Applications on the left and click the Create Application button.
- Click the Serverless application tab, search for VMware-Log-Insight-Cloud, and select it.
- Scroll down and in the Application settings section in the bottom right, provide the Wavefront proxy details.
- In the APIToken text box, enter
log-integration-token. - In the APIUrl text box, enter the Wavefront proxy URL.
- In the NameOfFunction text box, enter a meaningful name for the Lambda function.
- In the APIToken text box, enter
- Click Deploy.
- Add a trigger from the CloudWatch log stream.
- Navigate to your Lambda function and click it.
- Click the Add trigger button and from the drop-down menu select CloudWatch Logs.
- Select the CloudWatch Logs Log group that serves as the event source.
-
Give the filter a meaningful name and click Add.
Once you create the trigger, your function starts sending logs from CloudWatch to our service. It takes a few minutes for the CloudWatch logs to show up.
View the AWS CloudWatch Logs
View logs in the Logs Browser. It takes a few minutes for the CloudWatch logs to show up.
Alerts
- EC2 Instance CPU Usage Too High:Alert reports when the EC2 instance CPU utilization constantly exceeds the defined limit.
- EC2 Instance Status Check Failed:Alert reports when the EC2 status check constantly fails.
| Metric Name | Description |
|---|---|
| aws.cloudfront.4xxerrorrate.* | Statistics: average, maximum, minimum, samplecount, sum |
| aws.cloudfront.5xxerrorrate.* | Statistics: average, maximum, minimum, samplecount, sum |
| aws.cloudfront.bytesdownloaded.* | Statistics: average, maximum, minimum, samplecount, sum |
| aws.cloudfront.bytesuploaded.* | Statistics: average, maximum, minimum, samplecount, sum |
| aws.cloudfront.requests.* | Statistics: average, maximum, minimum, samplecount, sum |
| aws.cloudfront.totalerrorrate.* | Statistics: average, maximum, minimum, samplecount, sum |