This page provides an overview of what you can do with the VMware Tanzu Greenplum integration. The documentation pages only for a limited number of integrations contain the setup steps and instructions. If you do not see the setup steps here, navigate to the Operations for Applications GUI. The detailed instructions for setting up and configuring all integrations, including the VMware Tanzu Greenplum integration are on the Setup tab of the integration.
- Log in to your Operations for Applications instance.
- Click Integrations on the toolbar, search for and click the VMware Tanzu Greenplum tile.
- Click the Setup tab and you will see the most recent and up-to-date instructions.
VMware Tanzu Greenplum
VMware Tanzu Greenplum is a massively parallel processing (MPP) database server that supports next generation data warehousing and large-scale analytics processing. This integration installs and configures Telegraf to send system and query metrics into Tanzu Observability by Tanzu Observability. Telegraf is a light-weight server process capable of collecting, processing, aggregating, and sending metrics to a Wavefront proxy.
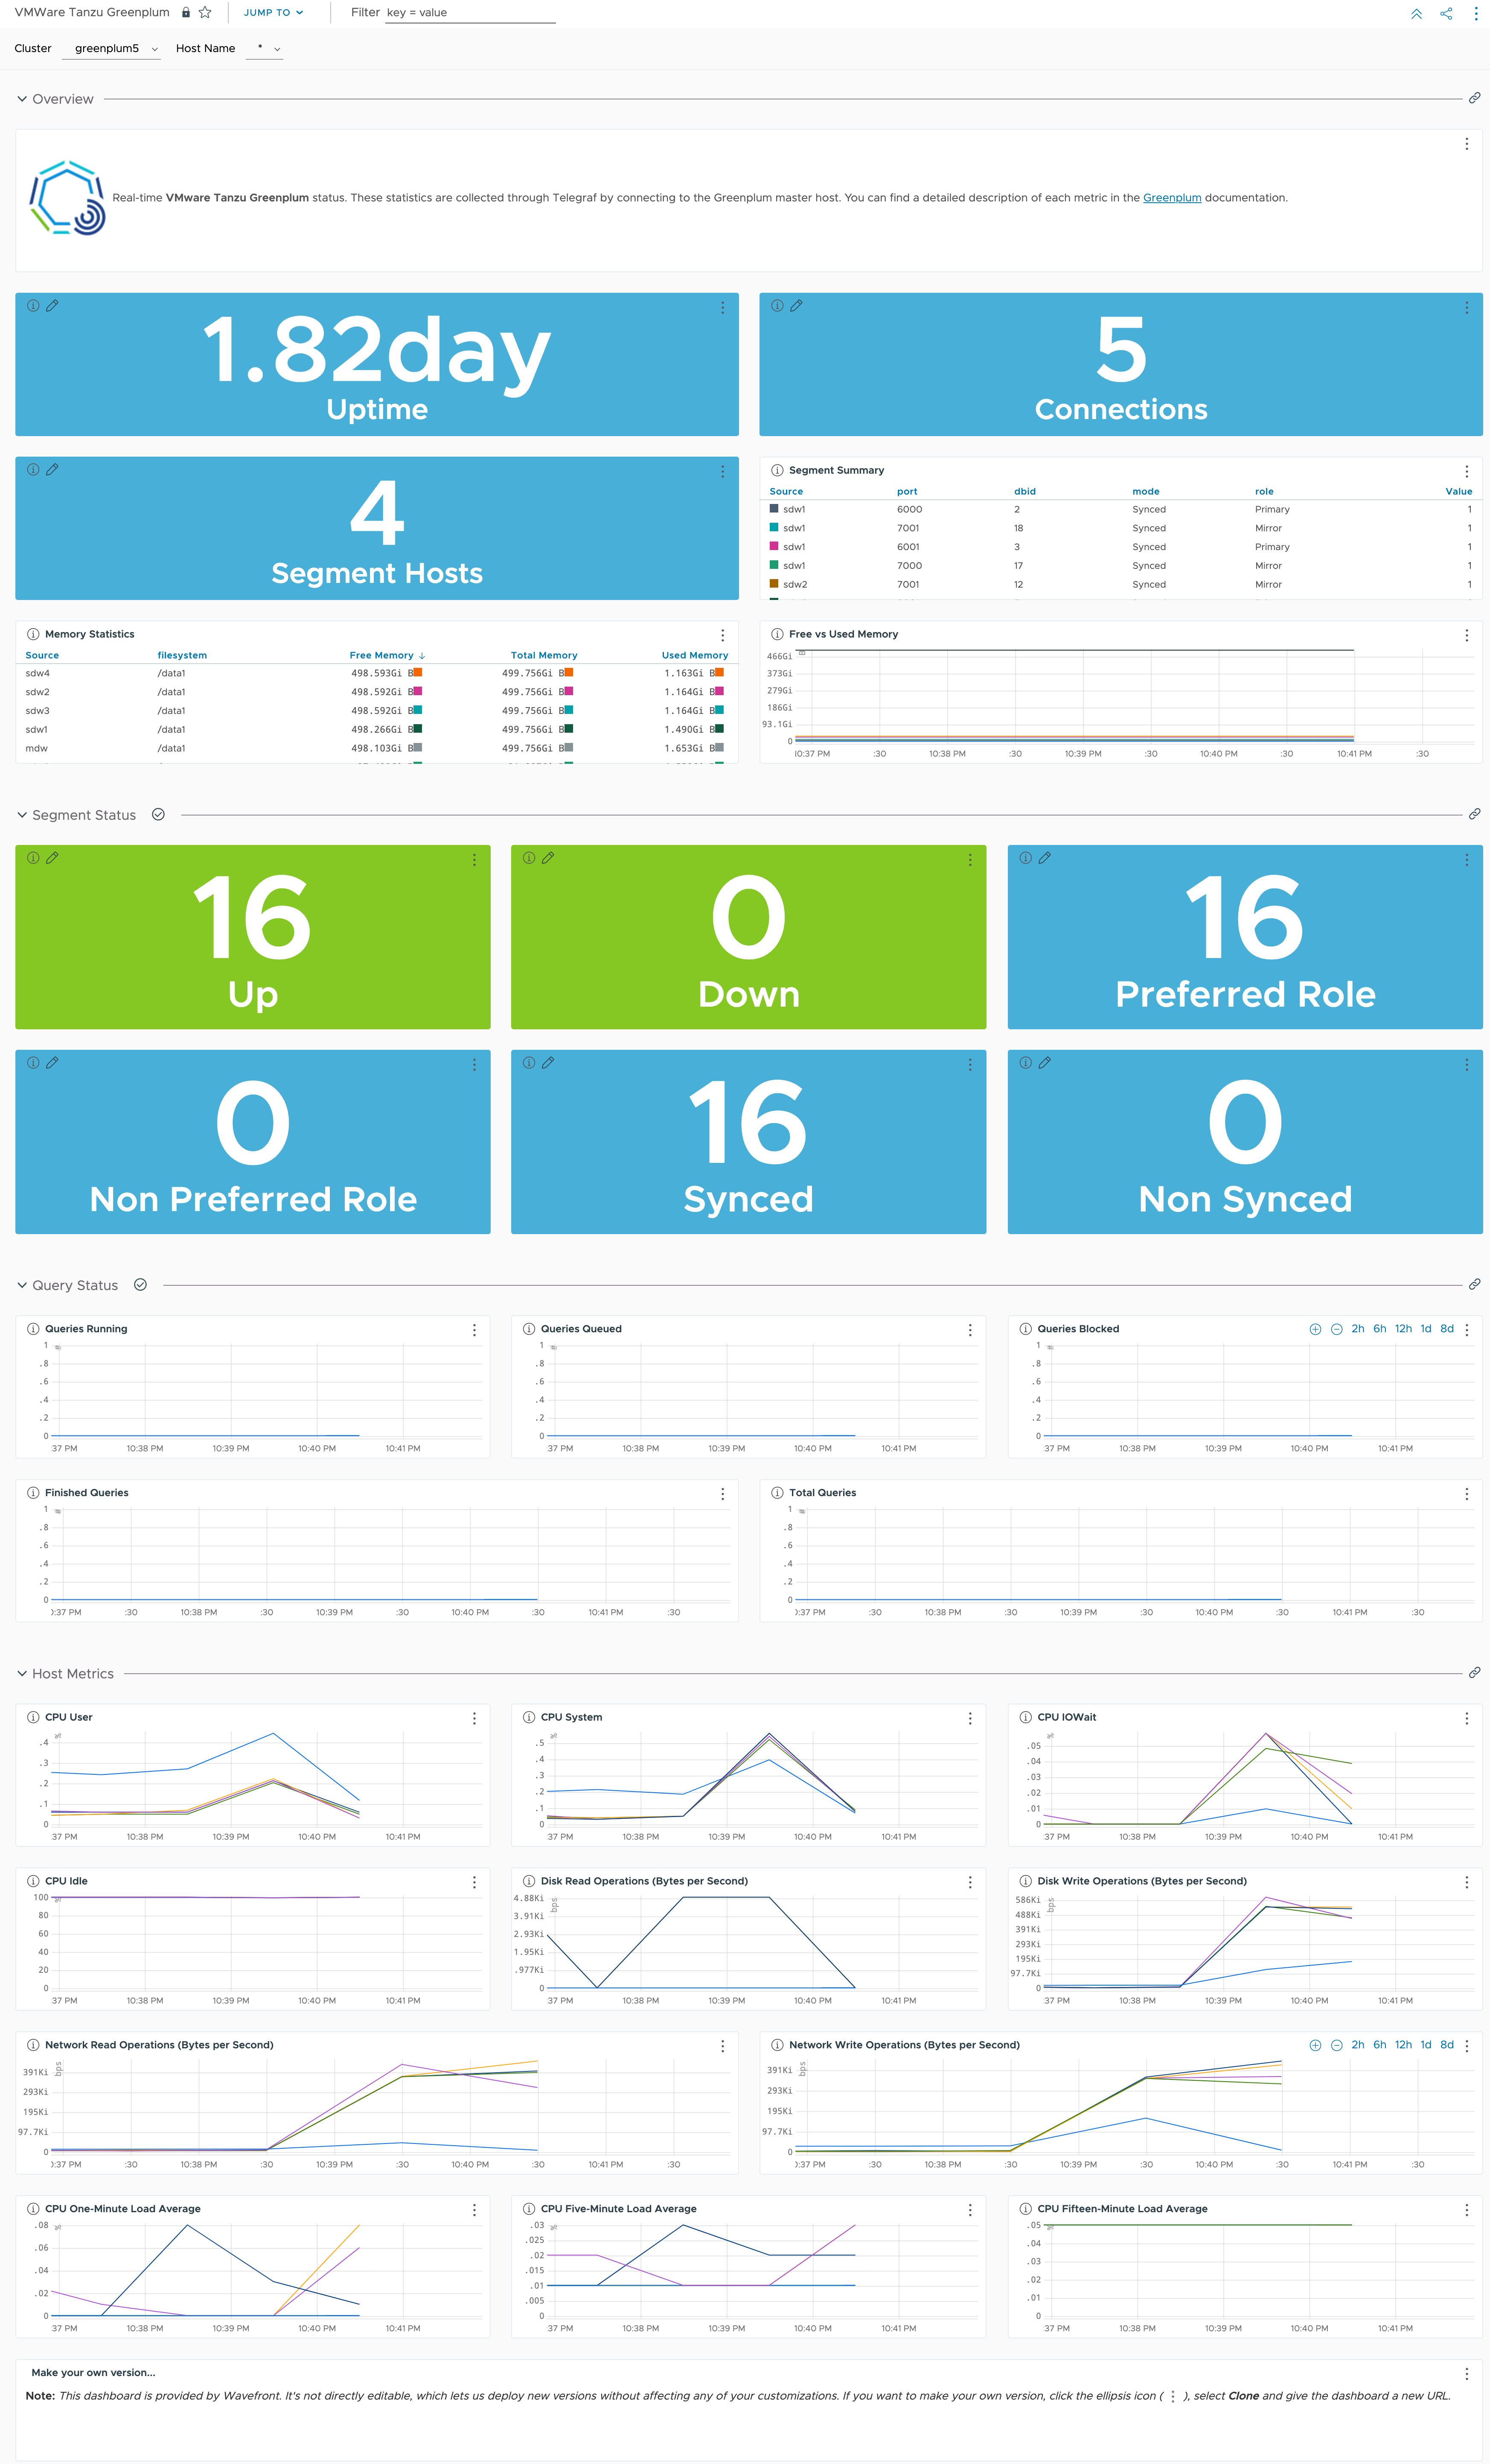
In addition to setting up the metrics flow, this integration also installs a dashboard. Here’s the dashboard displaying Tanzu Greenplum metrics.

Metrics
| Metric Name | Description |
|---|---|
| greenplum.postgresql.bytes.used | Number of storage bytes used. |
| greenplum.postgresql.bytes.available | Number of storage bytes available. |
| greenplum.postgresql.uptime | The elapsed time since the Greenplum Database system was last started. |
| greenplum.postgresql.connections | The number of active Greenplum Database sessions. |
| greenplum.postgresql.segment.hosts | Number of segment hosts. |
| greenplum.postgresql.status | The overall status of all segments. |
| greenplum.postgresql.cpu.idle | Percentage of idle CPU. |
| greenplum.postgresql.cpu.iowait | The percentage of CPU used to wait on IO requests. |
| greenplum.postgresql.cpu.sys | Percentage of time CPU processes are executed in system (kernel) mode. |
| greenplum.postgresql.cpu.user | Percentage of time CPU processes are executed in user mode. |
| greenplum.postgresql.disk.rb.rate | Bytes per second for disk read operations. |
| greenplum.postgresql.disk.wb.rate | Bytes per second for disk write operations. |
| greenplum.postgresql.net.rb.rate | Bytes per second on the system network for read operations. |
| greenplum.postgresql.net.wb.rate | Bytes per second on the system network for write operations. |
| greenplum.postgresql.load0 | CPU one-minute load average. |
| greenplum.postgresql.load1 | CPU five-minute load average. |
| greenplum.postgresql.load2 | CPU fifteen-minute load average. |
| greenplum.postgresql.queries.blocked | The number of queries started, but blocked by other transactions. |
| greenplum.postgresql.queries.finished | The number of queries that completed since the previous sampling interval. |
| greenplum.postgresql.queries.queued | Number of queries queued, but not yet running. |
| greenplum.postgresql.queries.running | Number of queries currently running. |
| greenplum.postgresql.queries.total | Total number of queries running and queued to run. |
| greenplum.postgresql.total.bytes | Total size of the file system storage in bytes. |
| greenplum.postgresql.upsegments | The number of segments with status Up. |
| greenplum.postgresql.downsegments | The number of segments with status Down. |
| greenplum.postgresql.mode.synced | The number of segment instances in sync with the mirror copy. |
| greenplum.postgresql.mode.nonsynced | The number of segment instances not in sync with the mirror copy. |
| greenplum.postgresql.nonpreferred.role | The number of segments which do not have a current role that was originally assigned at initialization time. |
| greenplum.postgresql.preferred.role | The number of segments which have a current role that was originally assigned at initialization time. |