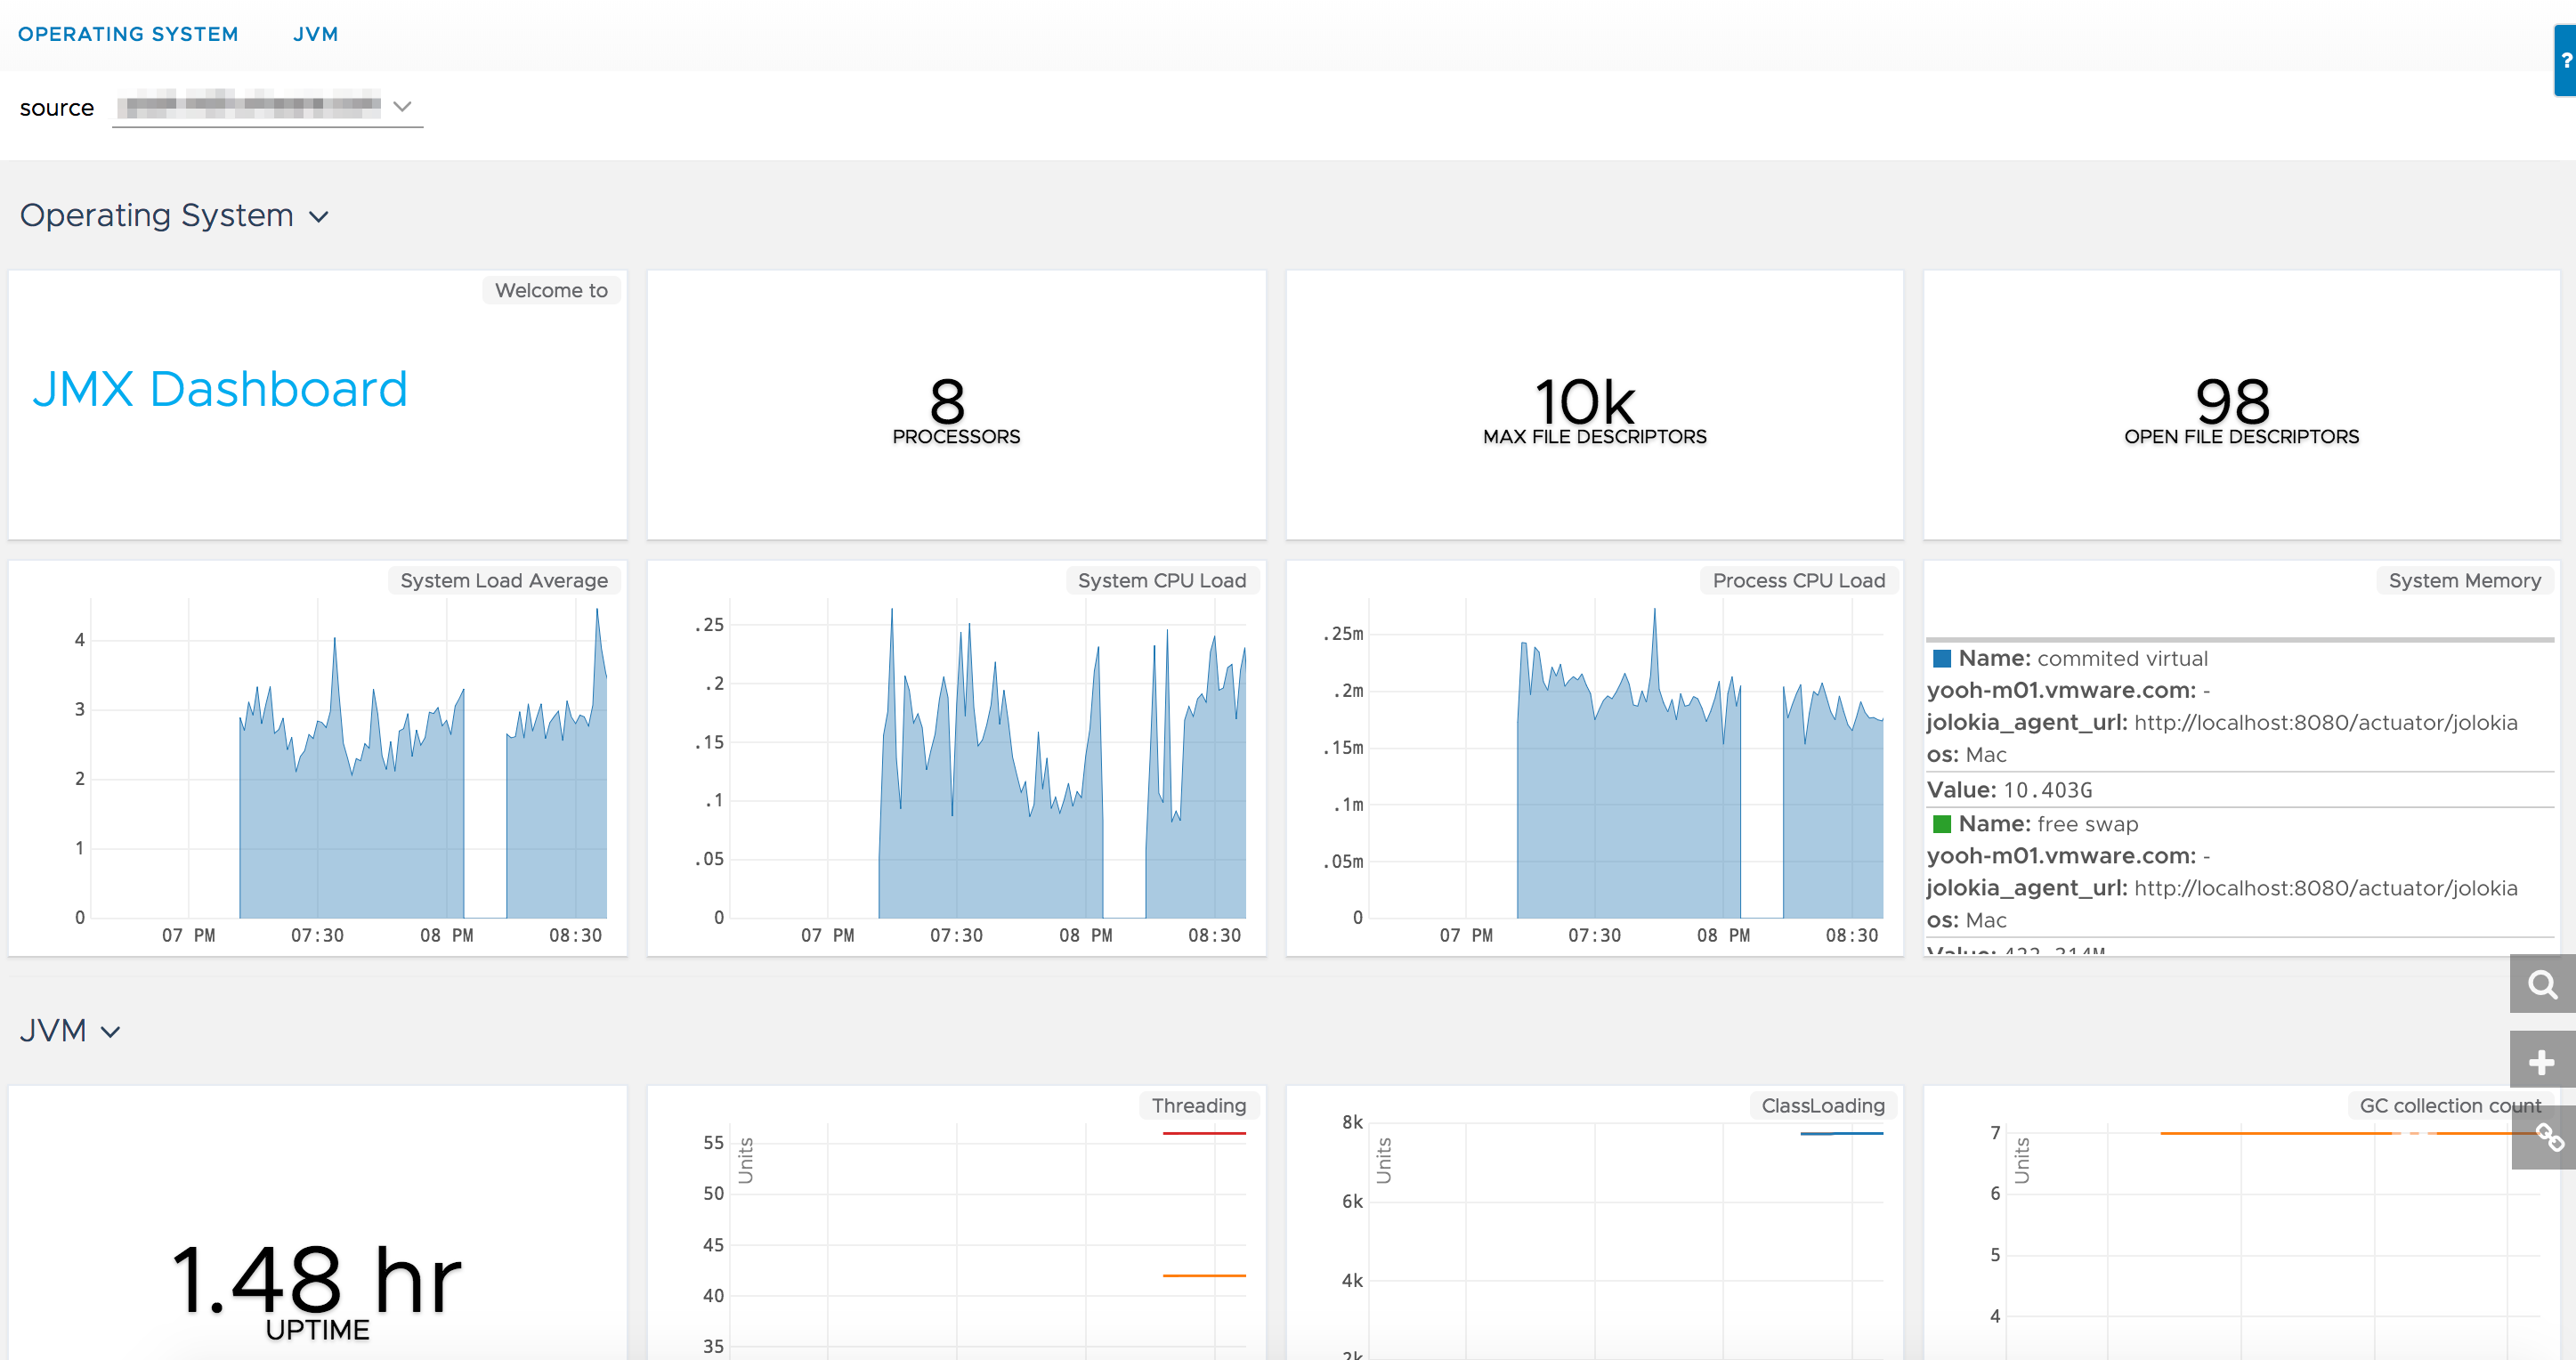
This page provides an overview of what you can do with the JMX integration. The documentation pages only for a limited number of integrations contain the setup steps and instructions. If you do not see the setup steps here, navigate to the Operations for Applications GUI. The detailed instructions for setting up and configuring all integrations, including the JMX integration are on the Setup tab of the integration.
- Log in to your Operations for Applications instance.
- Click Integrations on the toolbar, search for and click the JMX tile.
- Click the Setup tab and you will see the most recent and up-to-date instructions.
JMX Integration
The JMX technology provides a simple, standard way of managing resources such as applications, devices, and services. Because the JMX technology is dynamic, you can use it to monitor and manage resources as they are created, installed and implemented. You can also use the JMX technology to monitor and manage the Java Virtual Machine (Java VM).
Wavefront JMX integration uses Jolokia to setup and retrieve JMX metrics from a running Java instance, in a form of an embedded agent. After the JMX metrics are available on the web endpoint, the Telegraf that’s part of the integration retrieves the desired metrics using the jolokia plugin and sends it to Tanzu Observability.
In addition to setting up the metrics flow, this integration also sets up a dashboard.
