This page provides an overview of what you can do with the RabbitMQ integration. The documentation pages only for a limited number of integrations contain the setup steps and instructions. If you do not see the setup steps here, navigate to the Operations for Applications GUI. The detailed instructions for setting up and configuring all integrations, including the RabbitMQ integration are on the Setup tab of the integration.
- Log in to your Operations for Applications instance.
- Click Integrations on the toolbar, search for and click the RabbitMQ tile.
- Click the Setup tab and you will see the most recent and up-to-date instructions.
RabbitMQ Integration
RabbitMQ is a popular open source message broker. By setting up this integration, you can send RabbitMQ metrics to Operations for Applications.
-
RabbitMQ Metrics: This explains the installation and configuration of Telegraf to send RabbitMQ metrics into Operations for Applications. Telegraf is a light-weight server process capable of collecting, processing, aggregating, and sending metrics to a Wavefront proxy.
-
RabbitMQ on Kubernetes: This explains the configuration of Kubernetes Metrics Collector to scrape RabbitMQ metrics using prometheus plugin.
In addition to setting up the metrics flow, this integration also installs dashboards:
- RabbitMQ Metrics
- RabbitMQ on Kubernetes
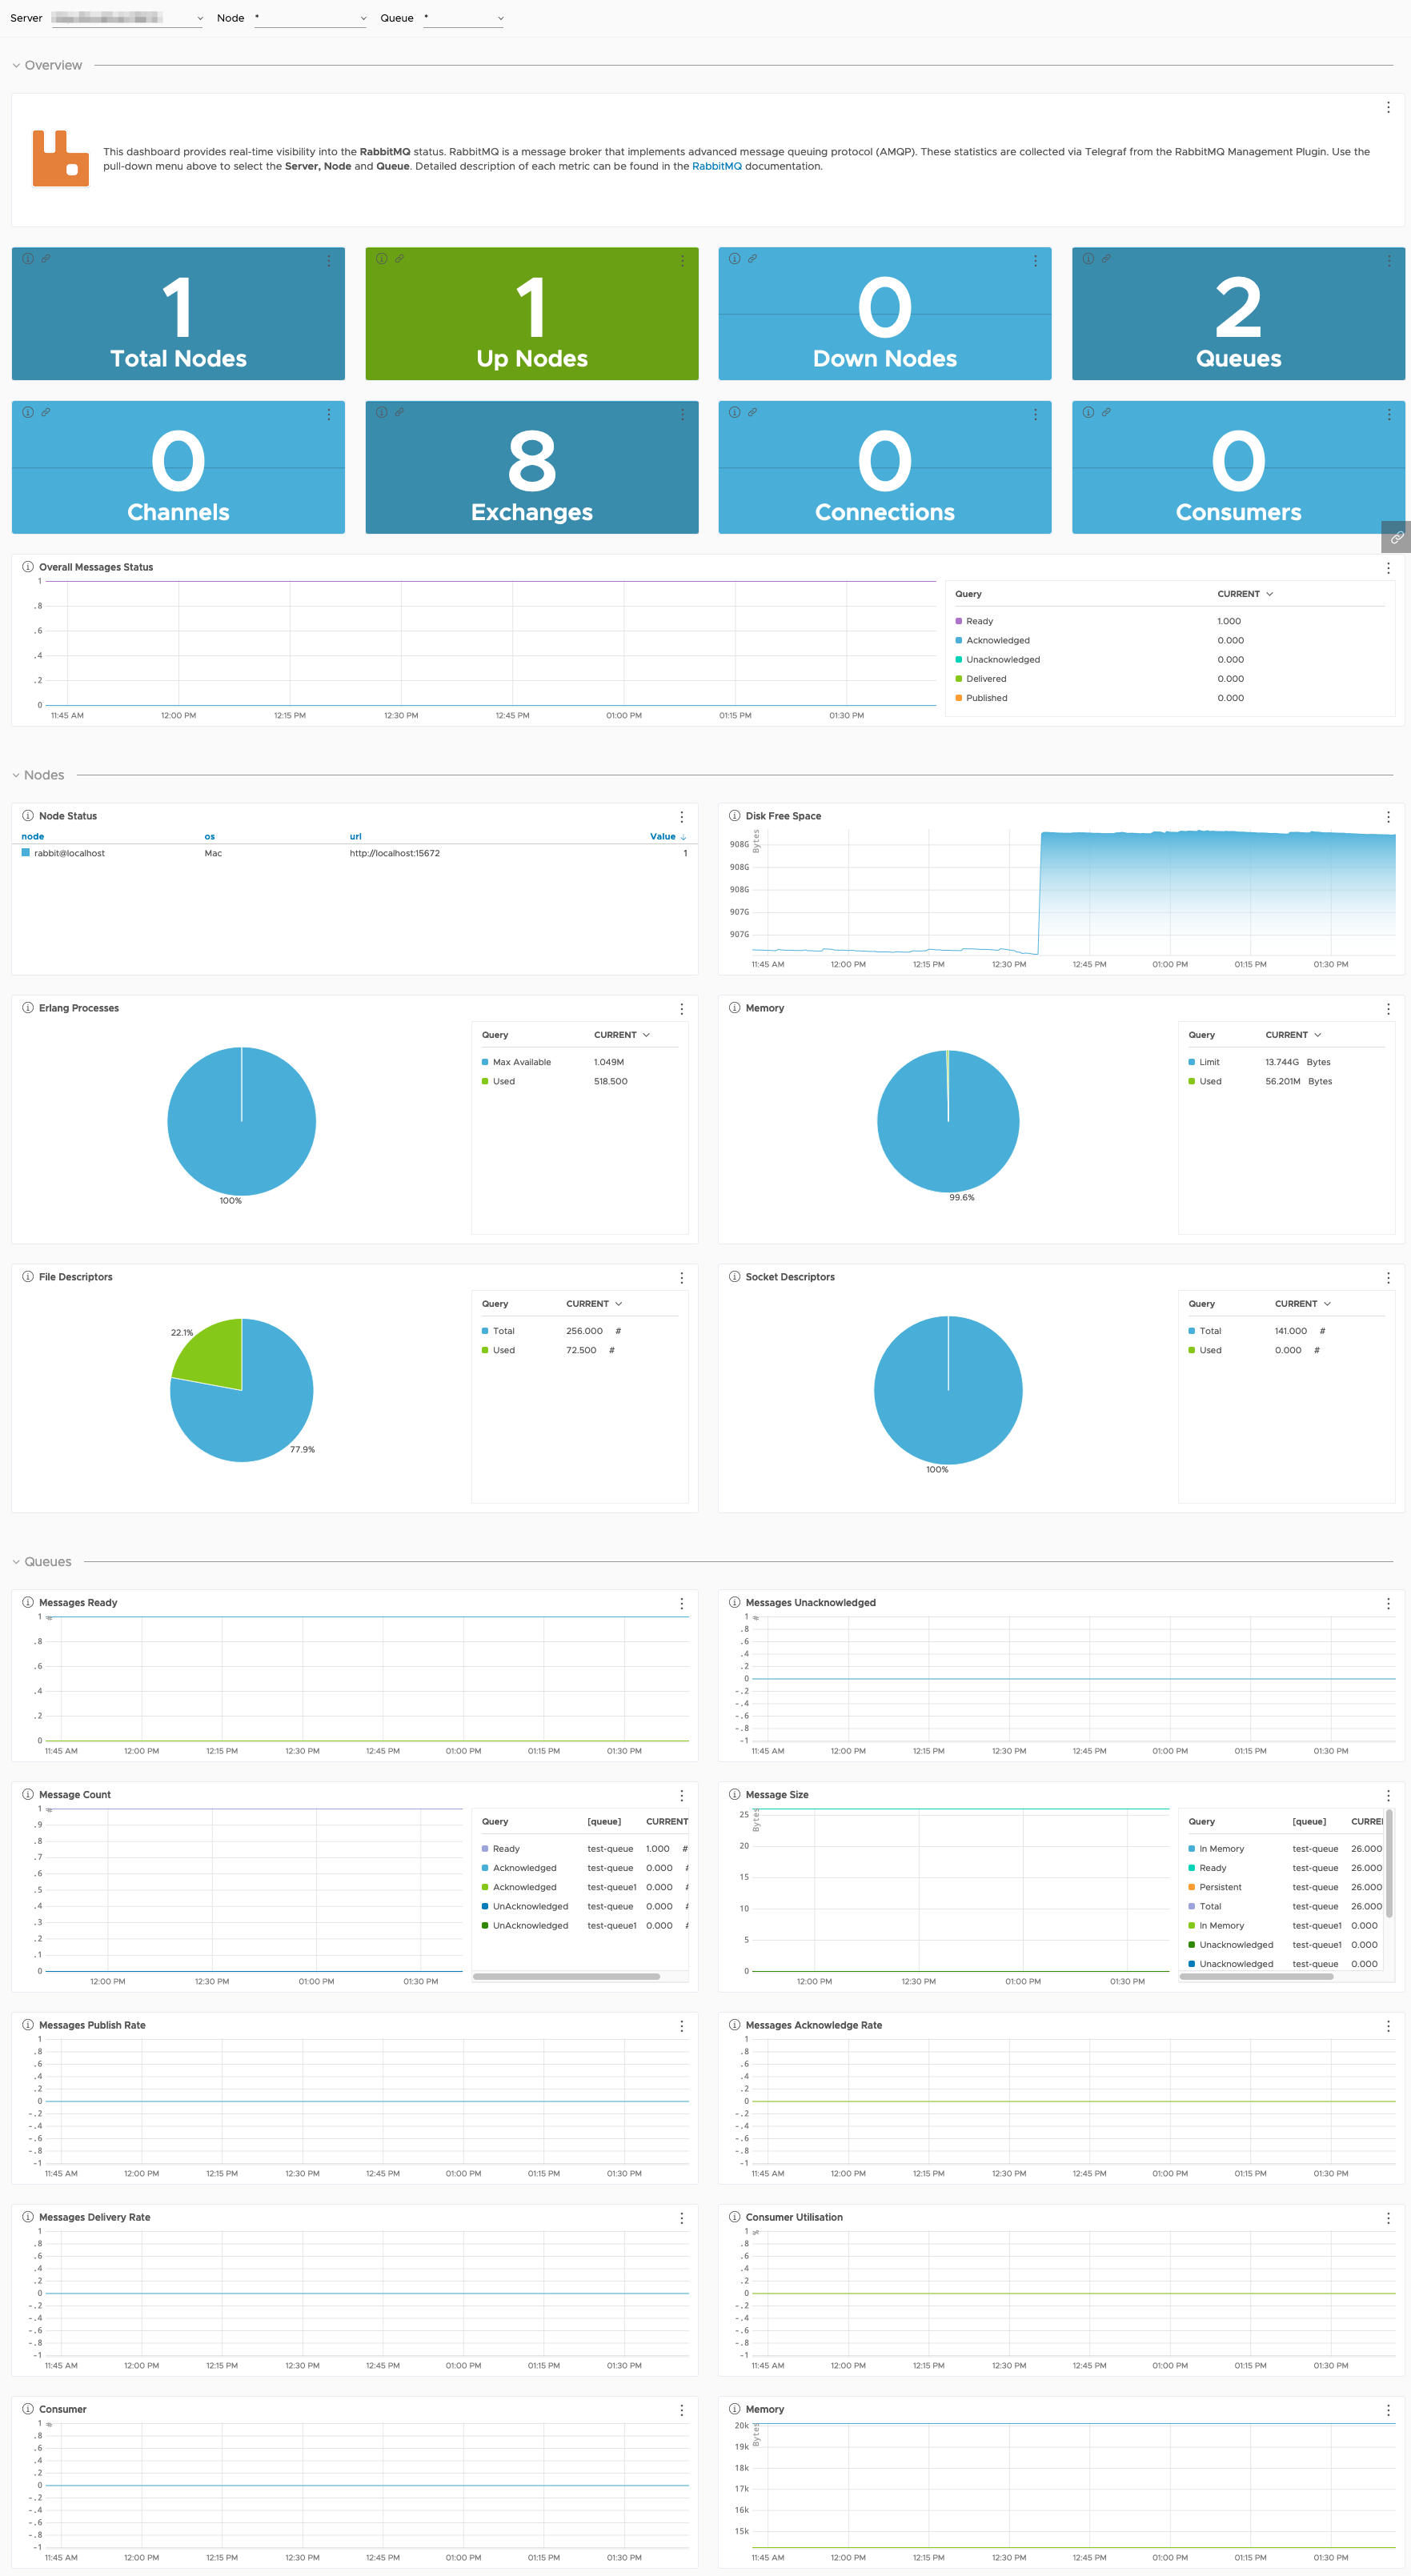
Here’s the screenshot of RabbitMQ dashboard displaying RabbitMQ metrics scraped using Telegraf plugin:
