This page provides an overview of what you can do with the VMware Spring Cloud Data Flow for Kubernetes integration. The documentation pages only for a limited number of integrations contain the setup steps and instructions. If you do not see the setup steps here, navigate to the Operations for Applications GUI. The detailed instructions for setting up and configuring all integrations, including the VMware Spring Cloud Data Flow for Kubernetes integration are on the Setup tab of the integration.
- Log in to your Operations for Applications instance.
- Click Integrations on the toolbar, search for and click the VMware Spring Cloud Data Flow for Kubernetes tile.
- Click the Setup tab and you will see the most recent and up-to-date instructions.
Spring Cloud Data Flow Integration
Tanzu Observability provides a comprehensive solution for monitoring Spring Cloud Data Flow (SCDF). This integration uses the Micrometer Wavefront registry to collect detailed metrics from SCDF server as well as the Stream and Task data pipelines managed by the SCDF servers.
The following diagram illustrates the Spring Cloud Data Flow metrics collection architecture:
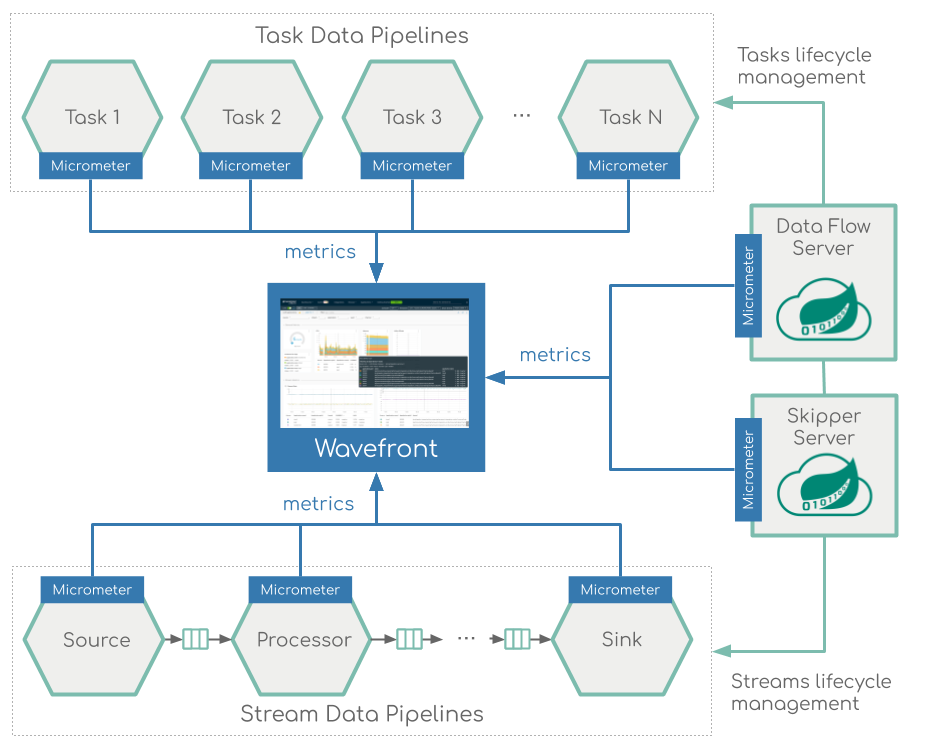
The Micrometer instrumentation library powers the delivery of application metrics from Spring Boot, including metrics for message rates and errors, which are critical to the monitoring of deployed event streaming and batch data pipelines in Spring Cloud Data Flow.
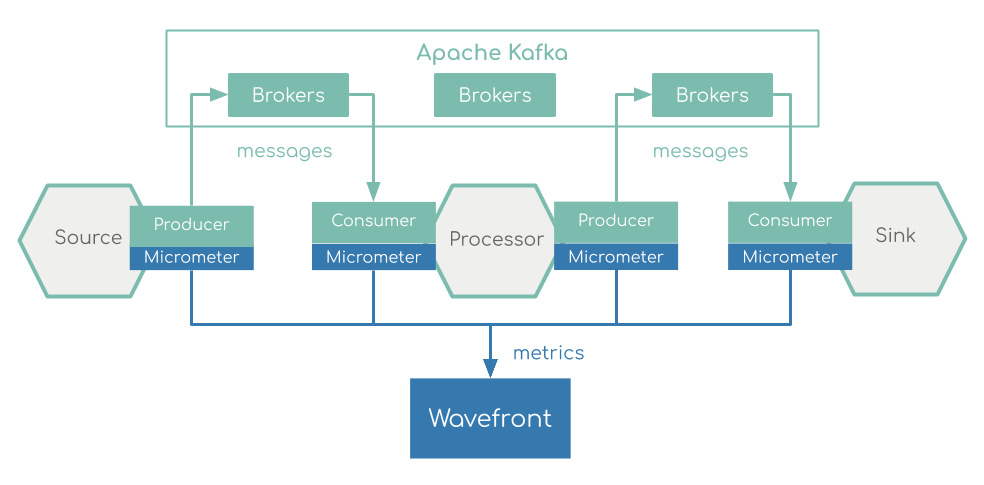
For Streaming data pipelines that use Kafka message binder, the native Apache Kafka Client metrics are collected and plotted in a dedicated dashboard:
Servers Monitoring
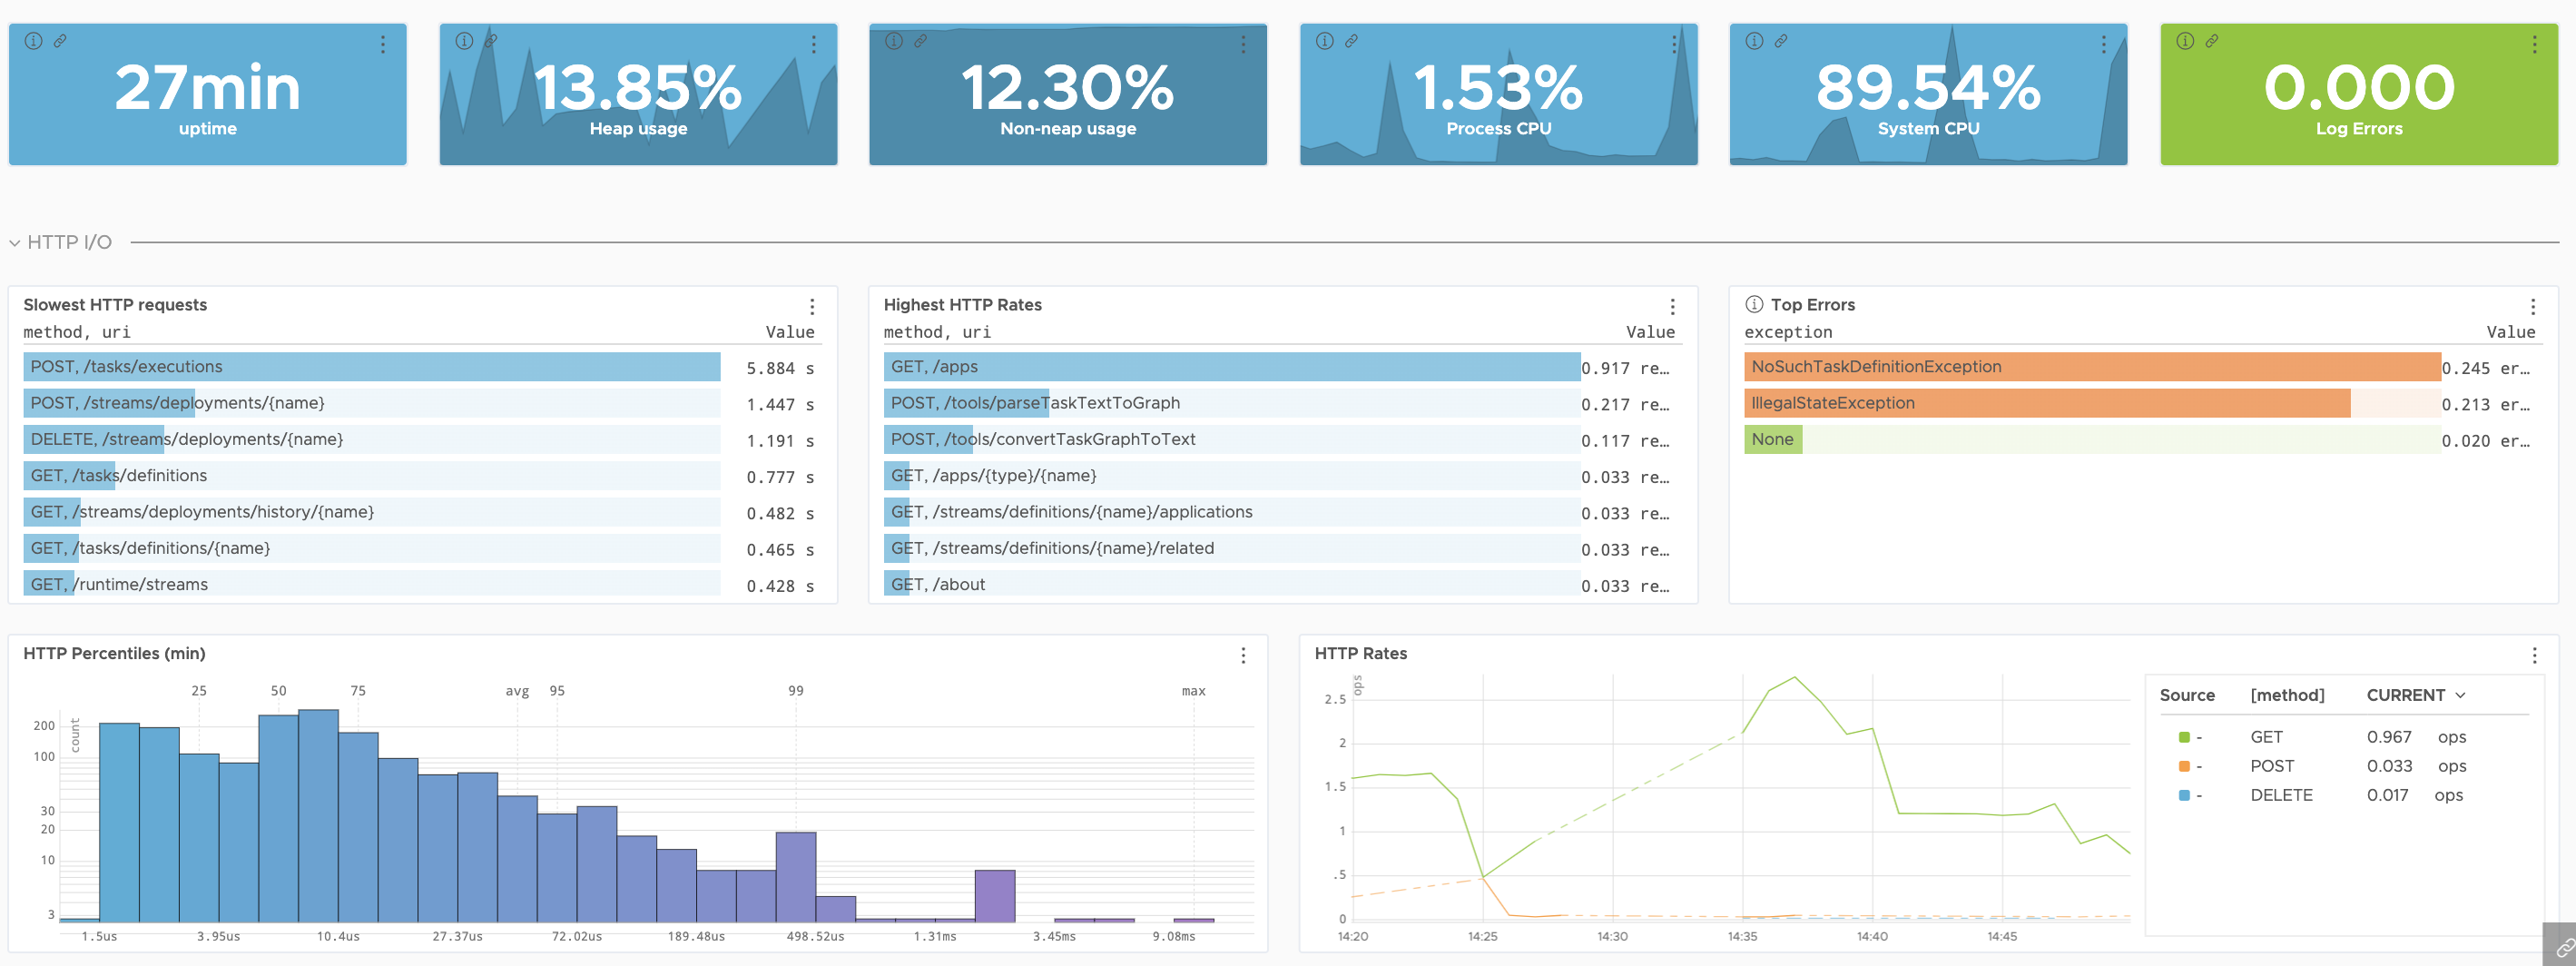
All Spring Cloud Data Flow and the Spring Cloud Skipper are instrumented for Wavefront metrics collection. This dashboard provides real-time visibility into the Spring Cloud Data Flow and Spring Cloud Skipper servers.
The Spring Cloud Stream applications add an additional application metrics tag, that allows metrics aggregation by server type (SCDF or Skipper):
application: The name of the Server (SCDF or Skipper applications name) to show metrics for.
Streams Monitoring
All Spring Cloud Stream Applications are instrumented for Wavefront metrics collection.
The Spring Cloud Stream applications add several, stream specific tags (below), that allow metrics aggregation by application type, instance, stream name, and so on:
stream.name: The name of the Stream that contains the applications emitting the metrics.application.name: Thename(or thelabel) of the application within the Stream emitting the metrics.application.type: The application role (e.g.source,processor, orsink) within the Stream emitting the metrics.application.guid: Unique application instance identifier. Everyapplication.namecan have multiple instance.application.index: Application instance ID (when available).
Tasks Monitoring
The integration supports monitoring of Task applications that were deployed as part of a Task definition in Data Flow.
The Spring Cloud Task applications add several task-specific tags that allow metric aggregation by application type, instance id or task name:
task.name: The name of the Task application that emits the metrics.task.execution.id: The instance id of the executed task. A task can be executed many times with the same name but a different execution ID.task.external.execution.id: Task identifier inside the external platforms (e.g. Cloud Foundry or Kubernetes) where the task is run.task.parent.execution.id: If a task is run by another task the parent id is used to identify the task run it.
Dashboards
In addition to setting up the metrics flow, this integration also installs dashboards:
- Spring Cloud Data Flow and Skipper Servers: Real-time visibility into the Spring Cloud Data Flow and Spring Cloud Skipper servers.
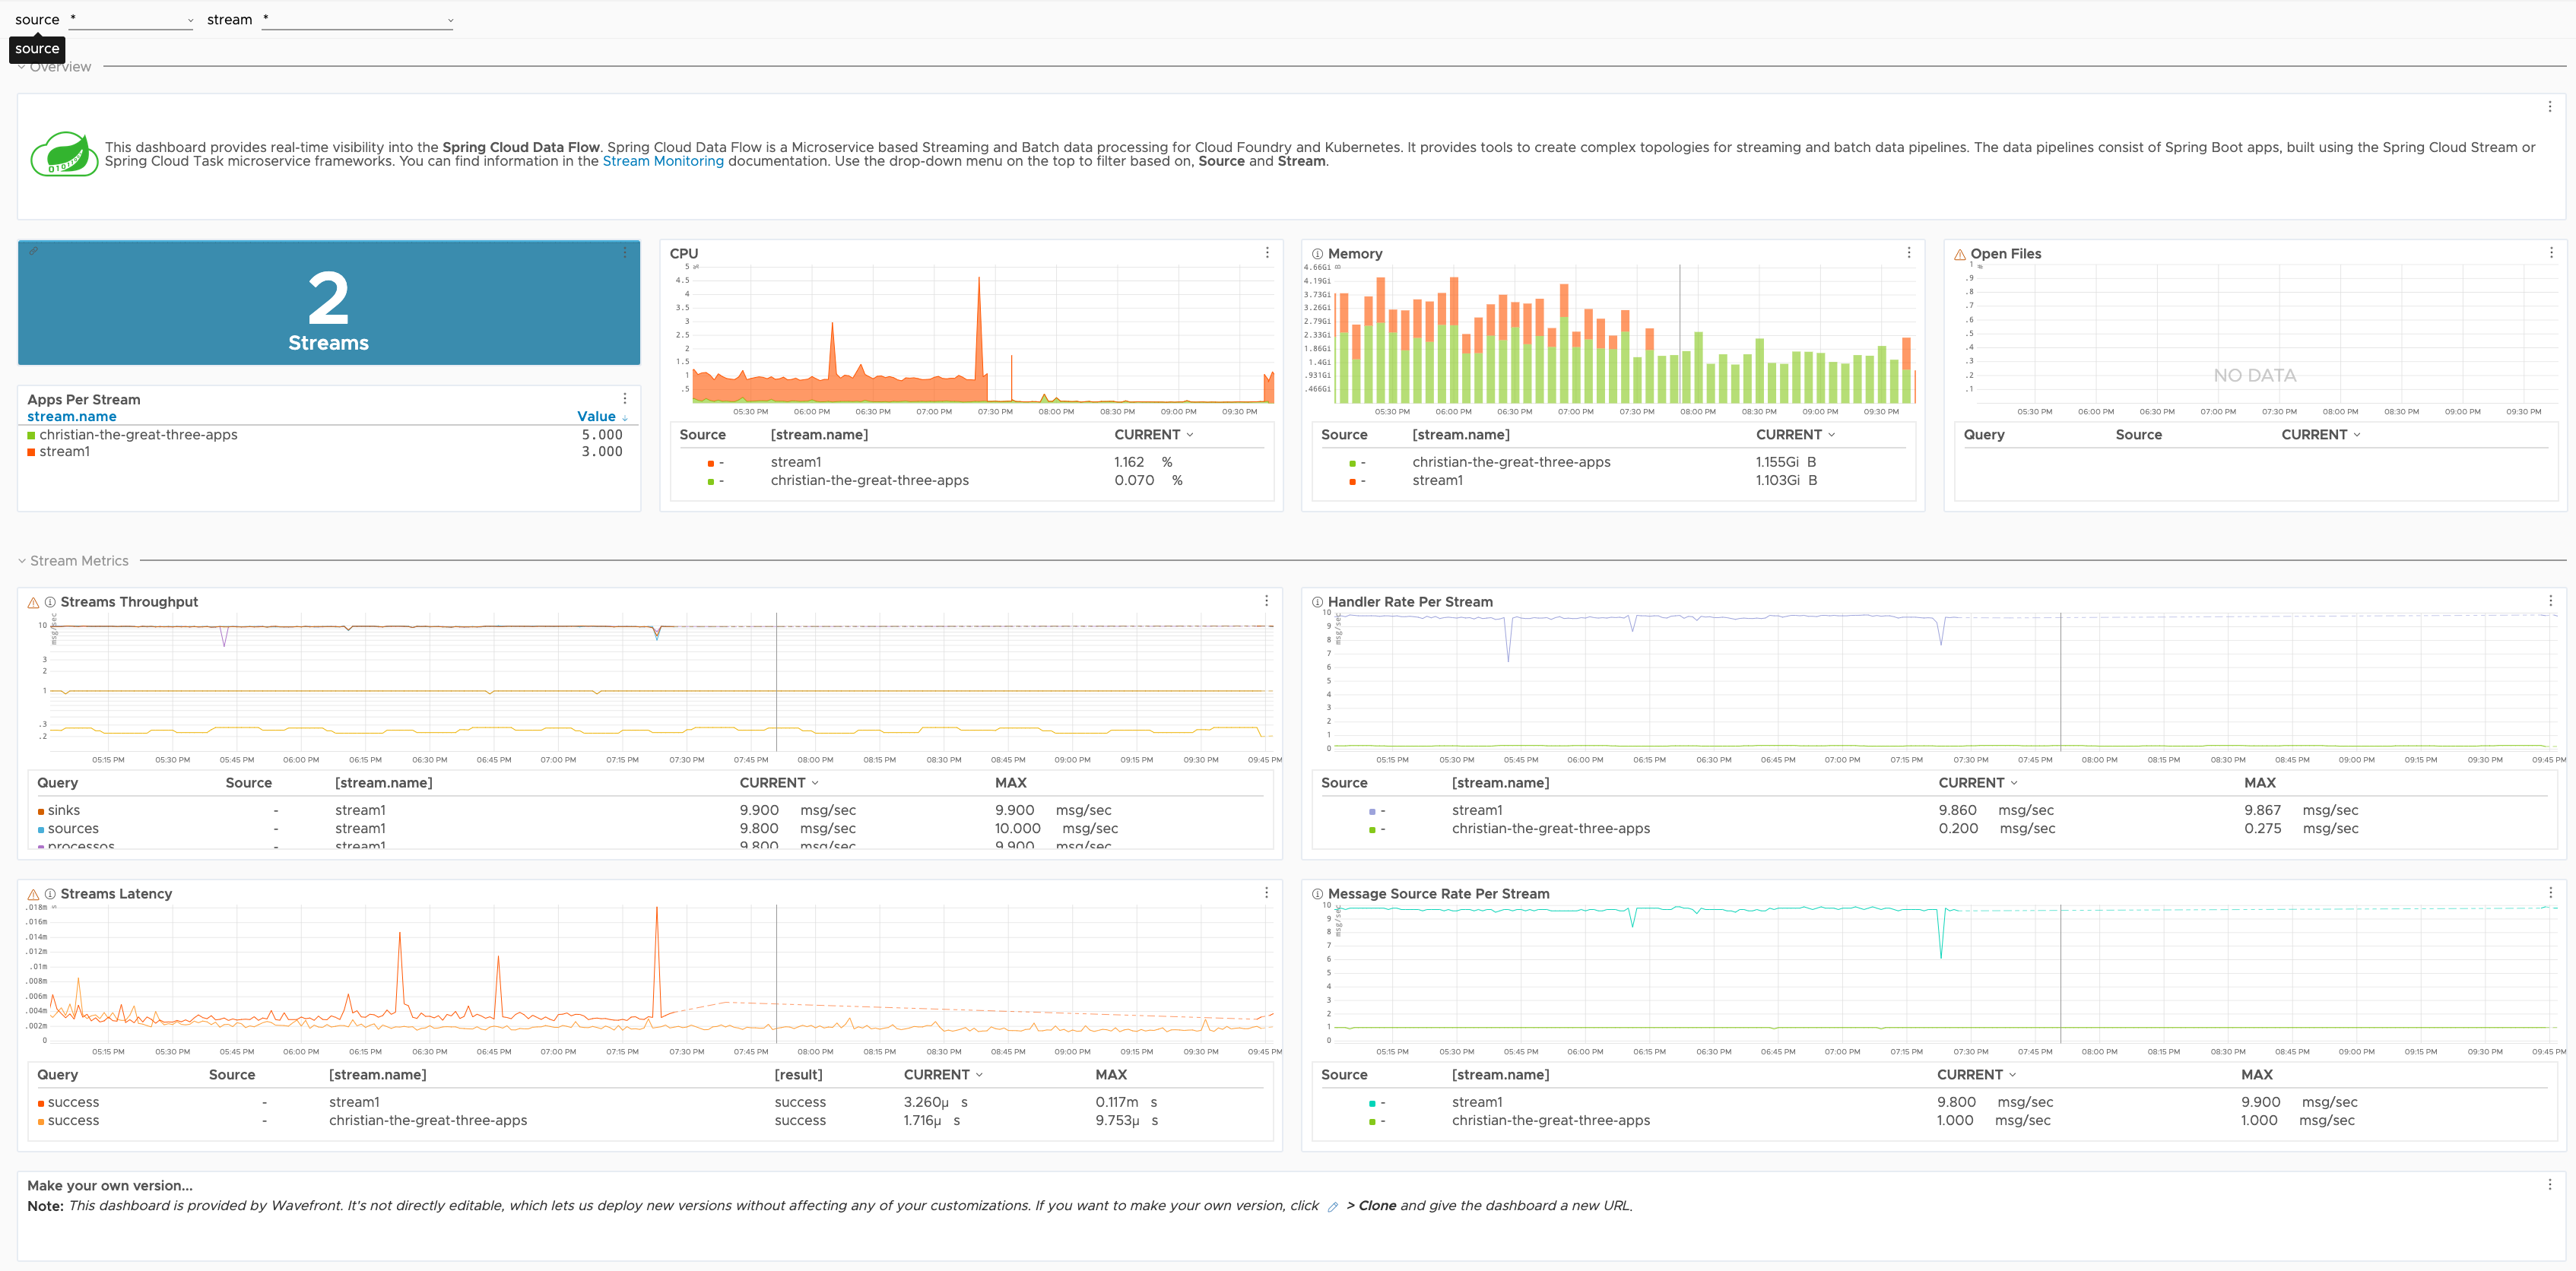
- Spring Cloud Data Flow Streams Summary: Performance overview for all event streaming data pipelines deployed by DataFlow. One can compare the average performance per stream, CPU, memory, message throughput, latency, and other metrics.
- Spring Cloud Data Flow Stream Applications: A detailed real-time performance report of all stream applications that are part of a single event streaming data pipeline. One can filter down metrics for a particular application, instance, or channel.
- Spring Cloud Data Flow Kafka Stream Applications: A detailed real-time performance report of all Kafka stream applications that are part of a single event streaming data pipeline. One can filter down metrics for a particular application, instance, or channel.
- Spring Cloud Data Flow Task Applications: A detailed real-time performance report for all Task applications.
Here’s a preview of the Spring Cloud Data Flow and Skipper Server dashboard:
Here’s a preview of the Spring Cloud Data Flow Stream Summary dashboard:
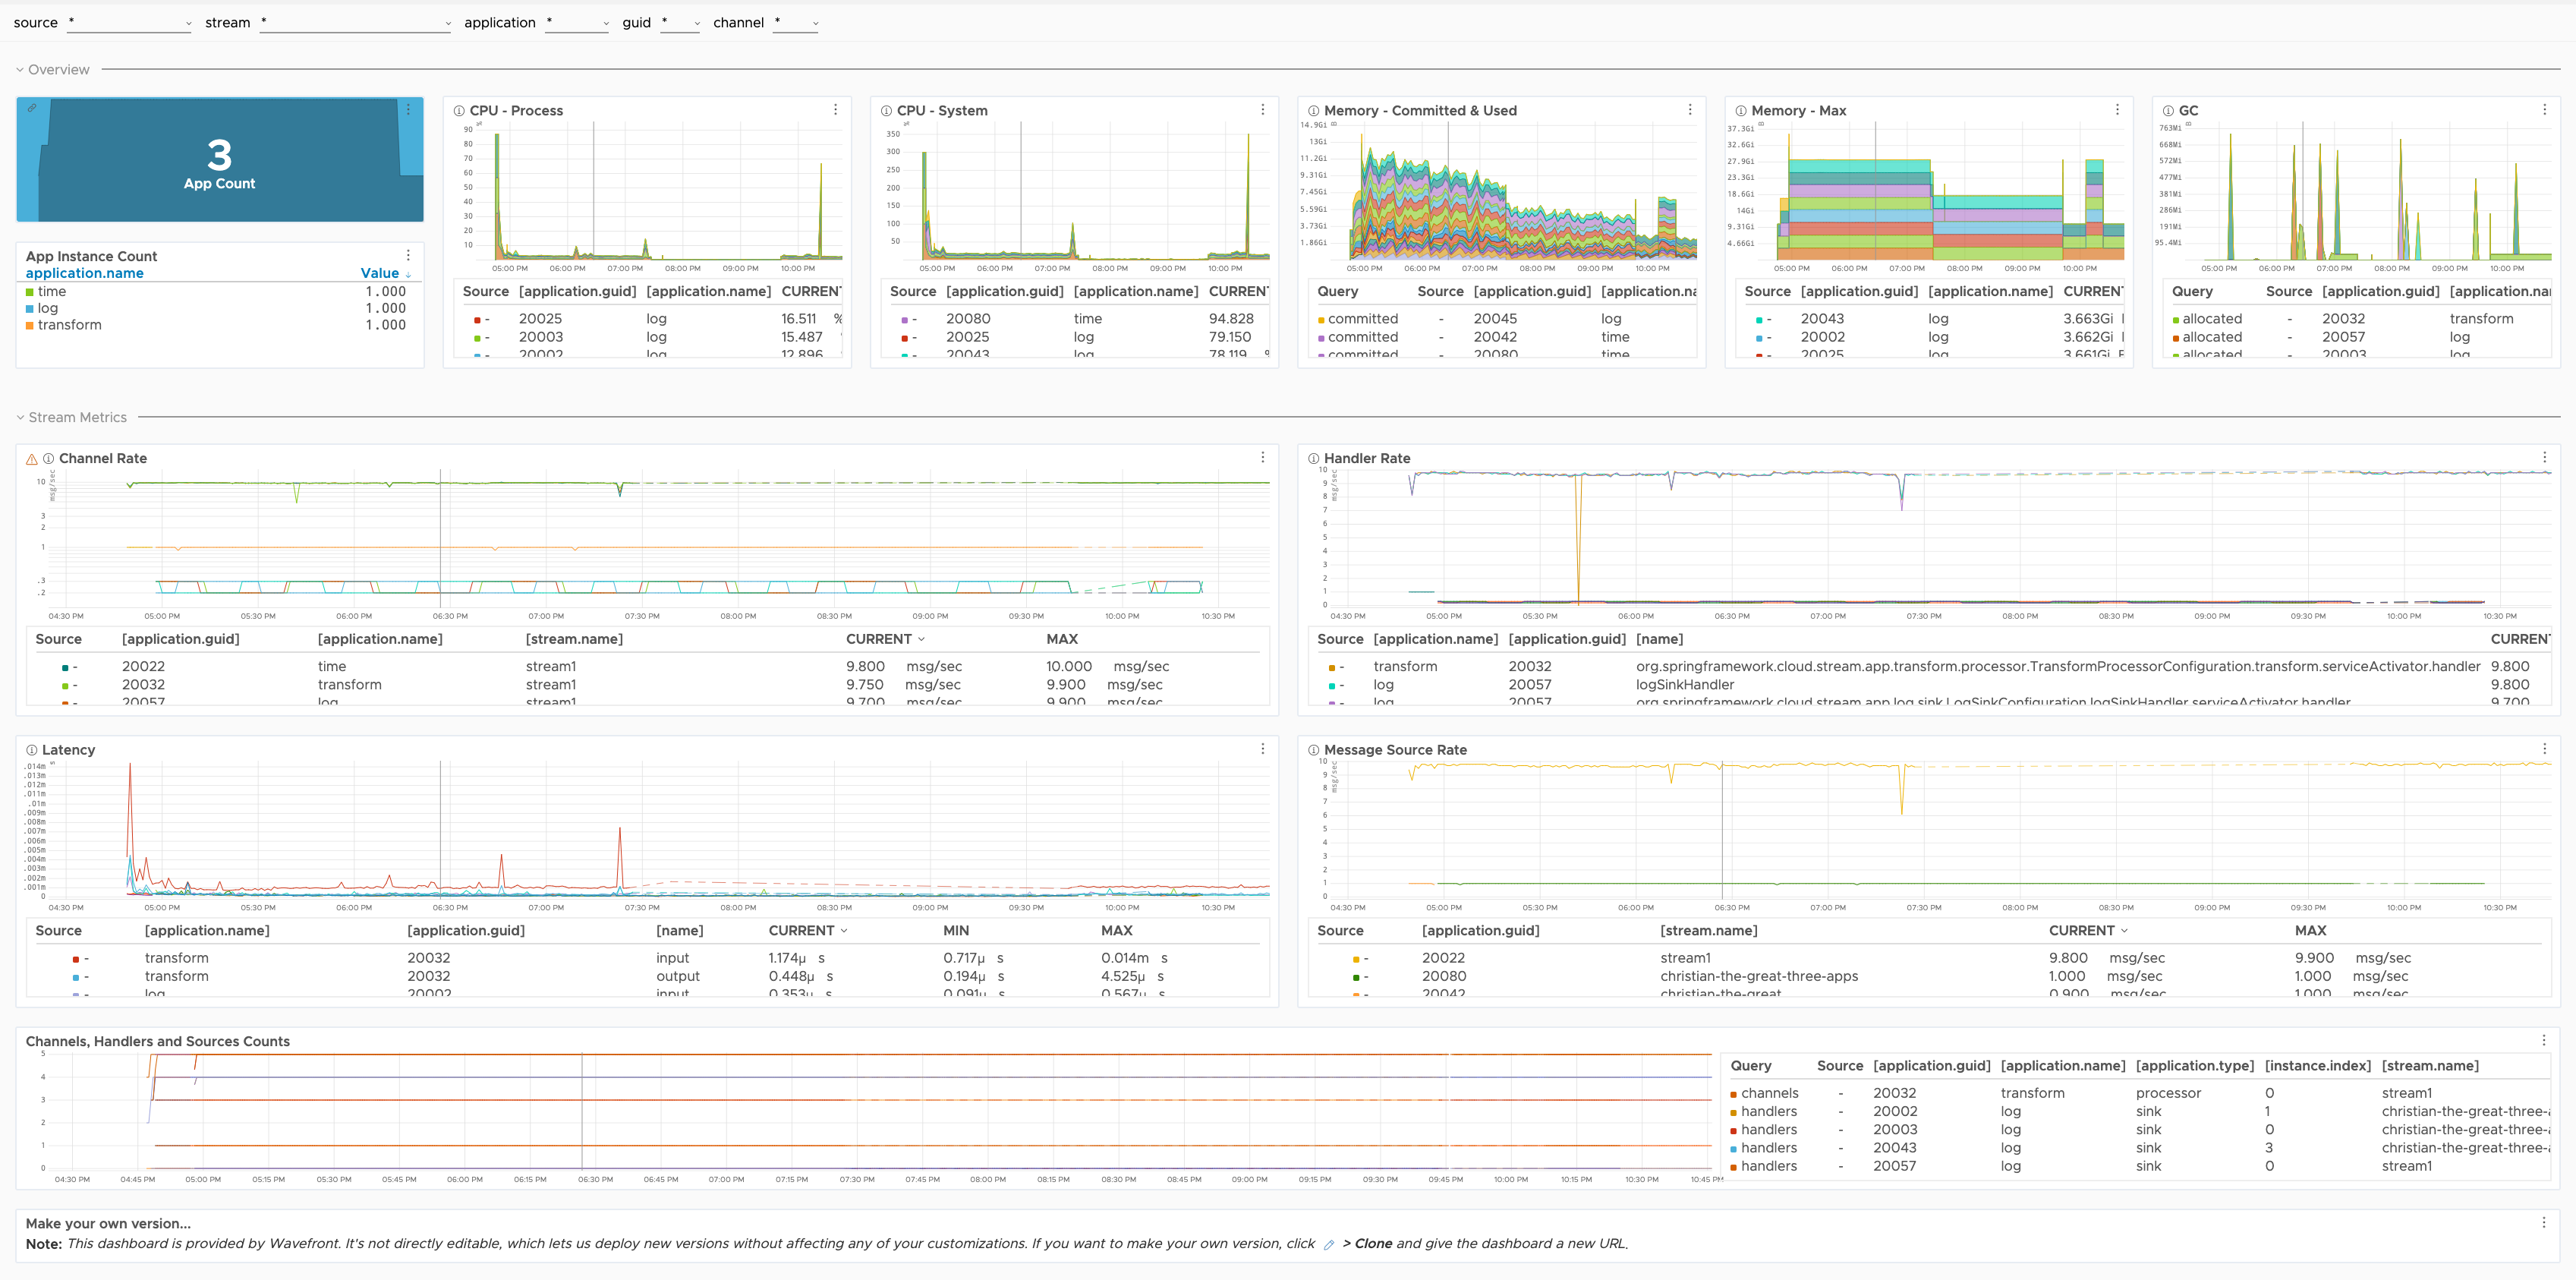
Here’s a preview of the Spring Cloud Data Flow Stream applications dashboard:
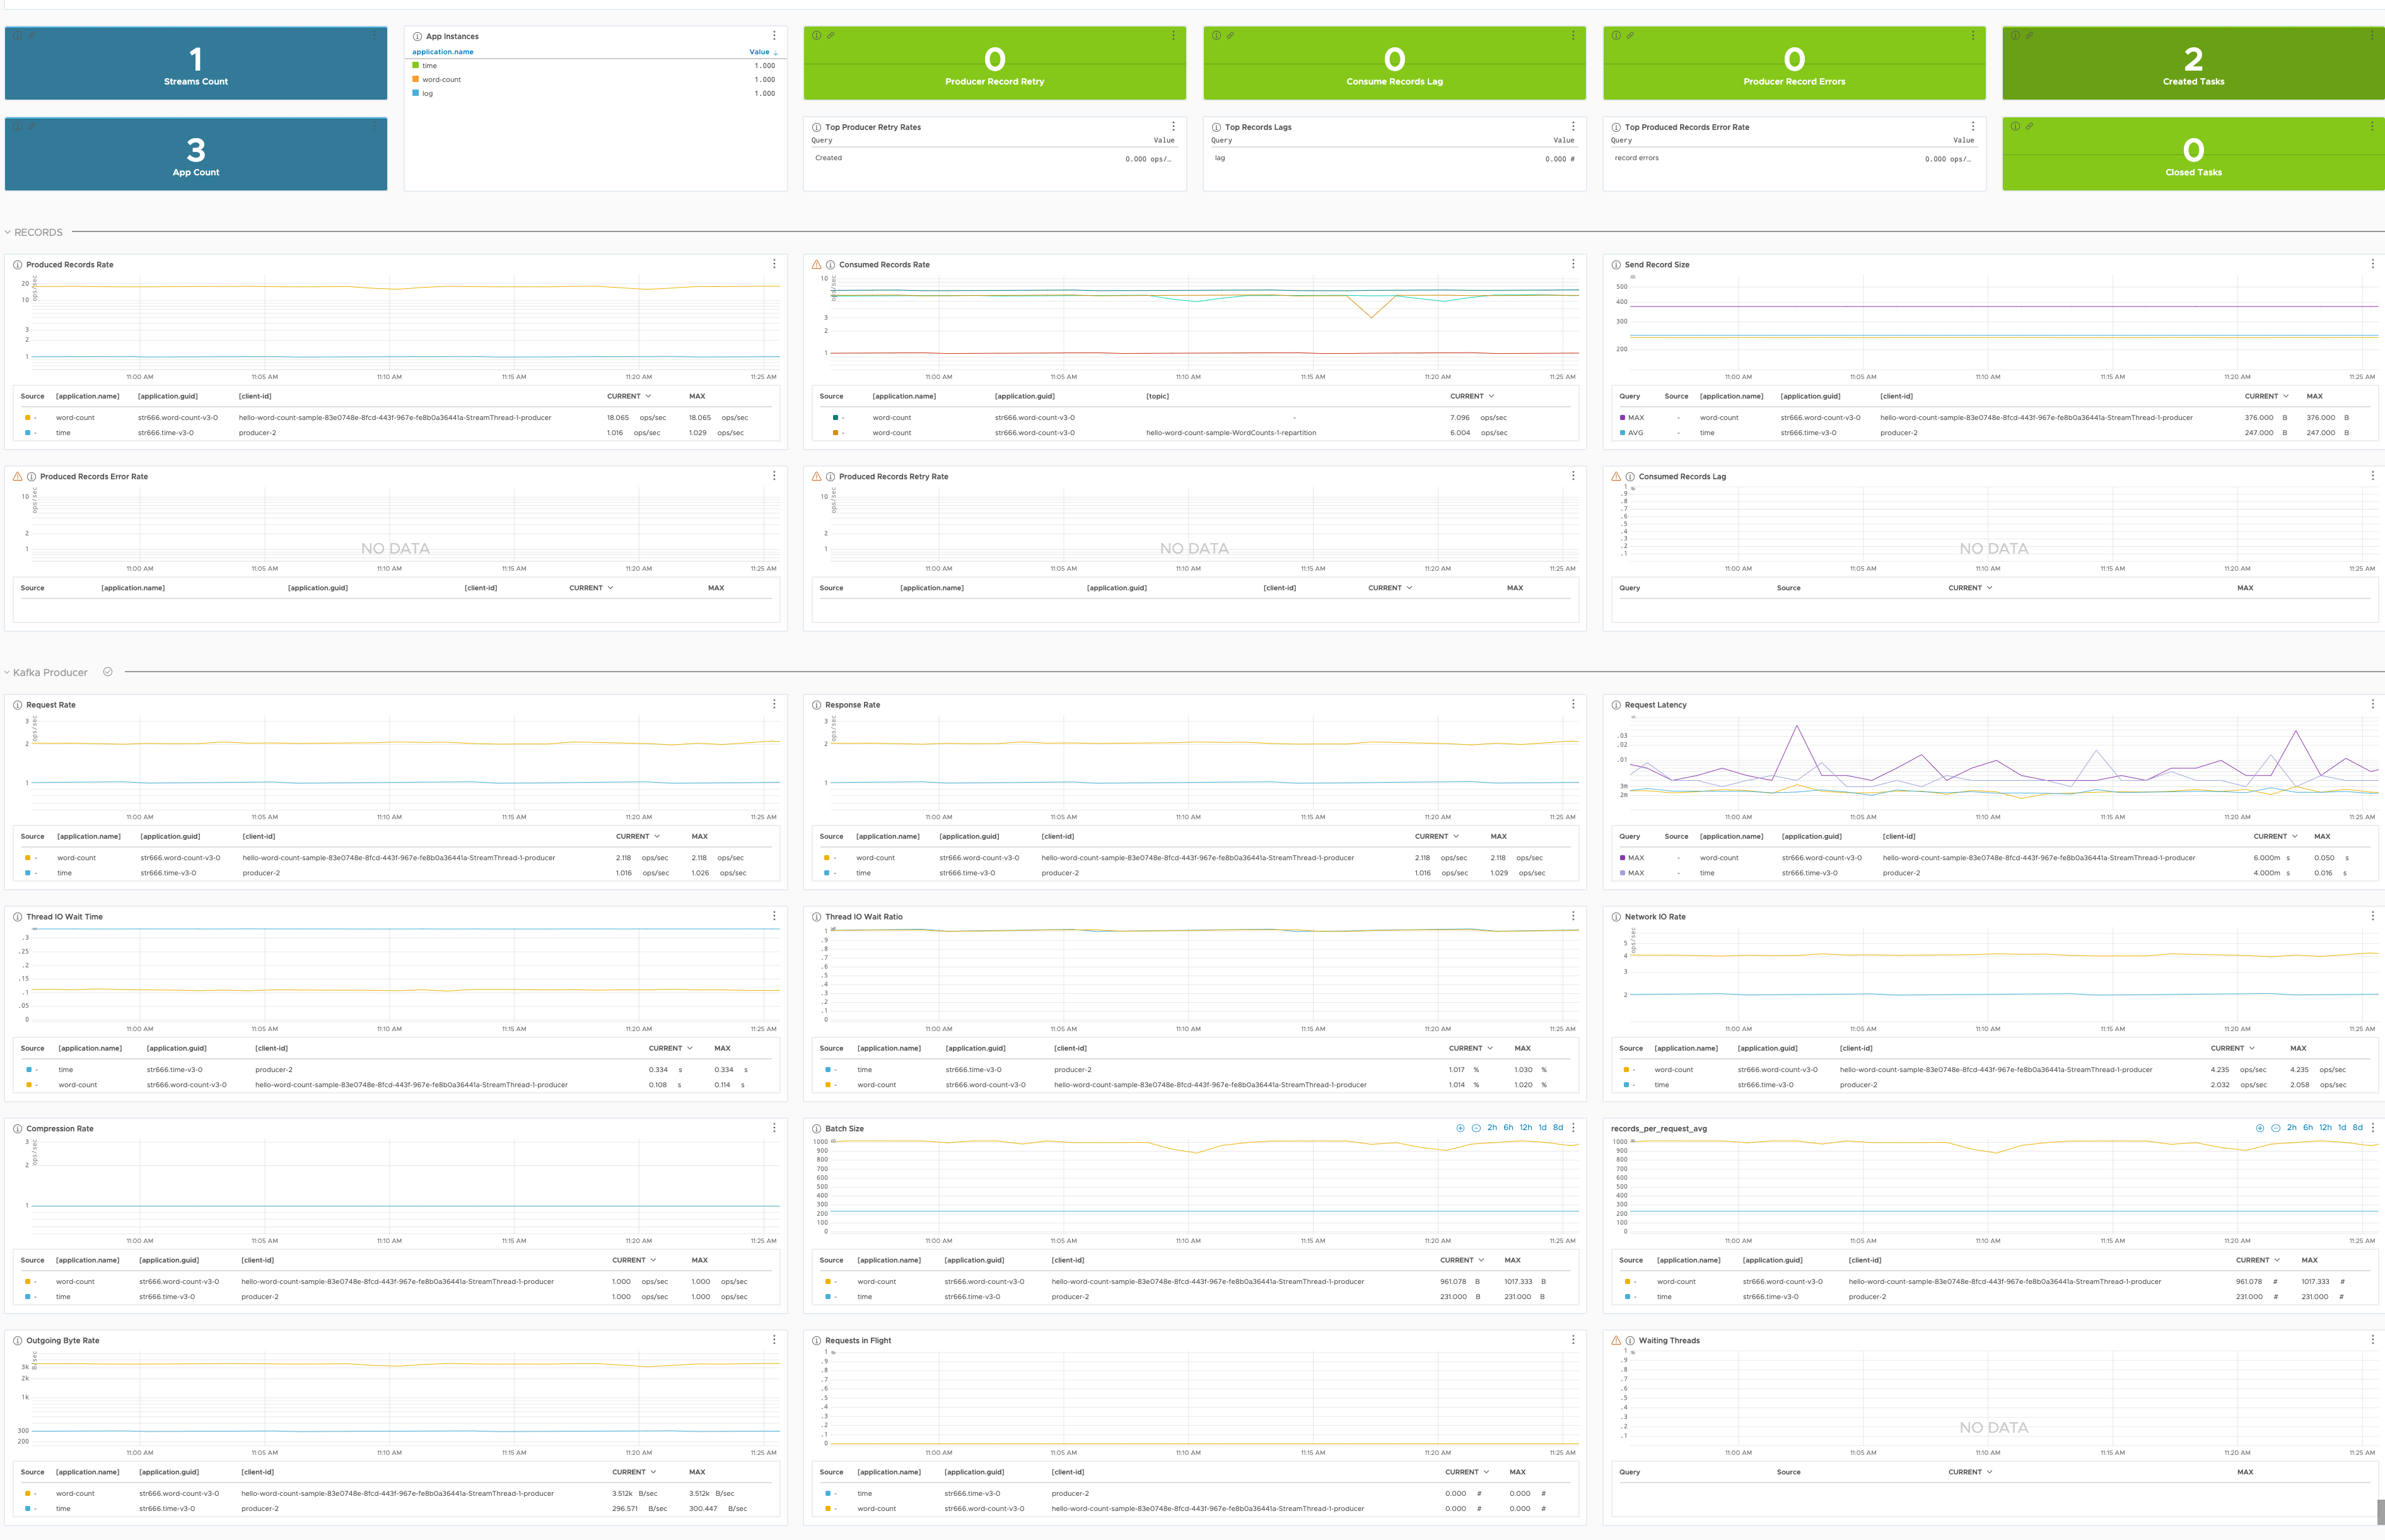
Here’s a preview of the Spring Cloud Data Flow Kafka Stream applications dashboard:
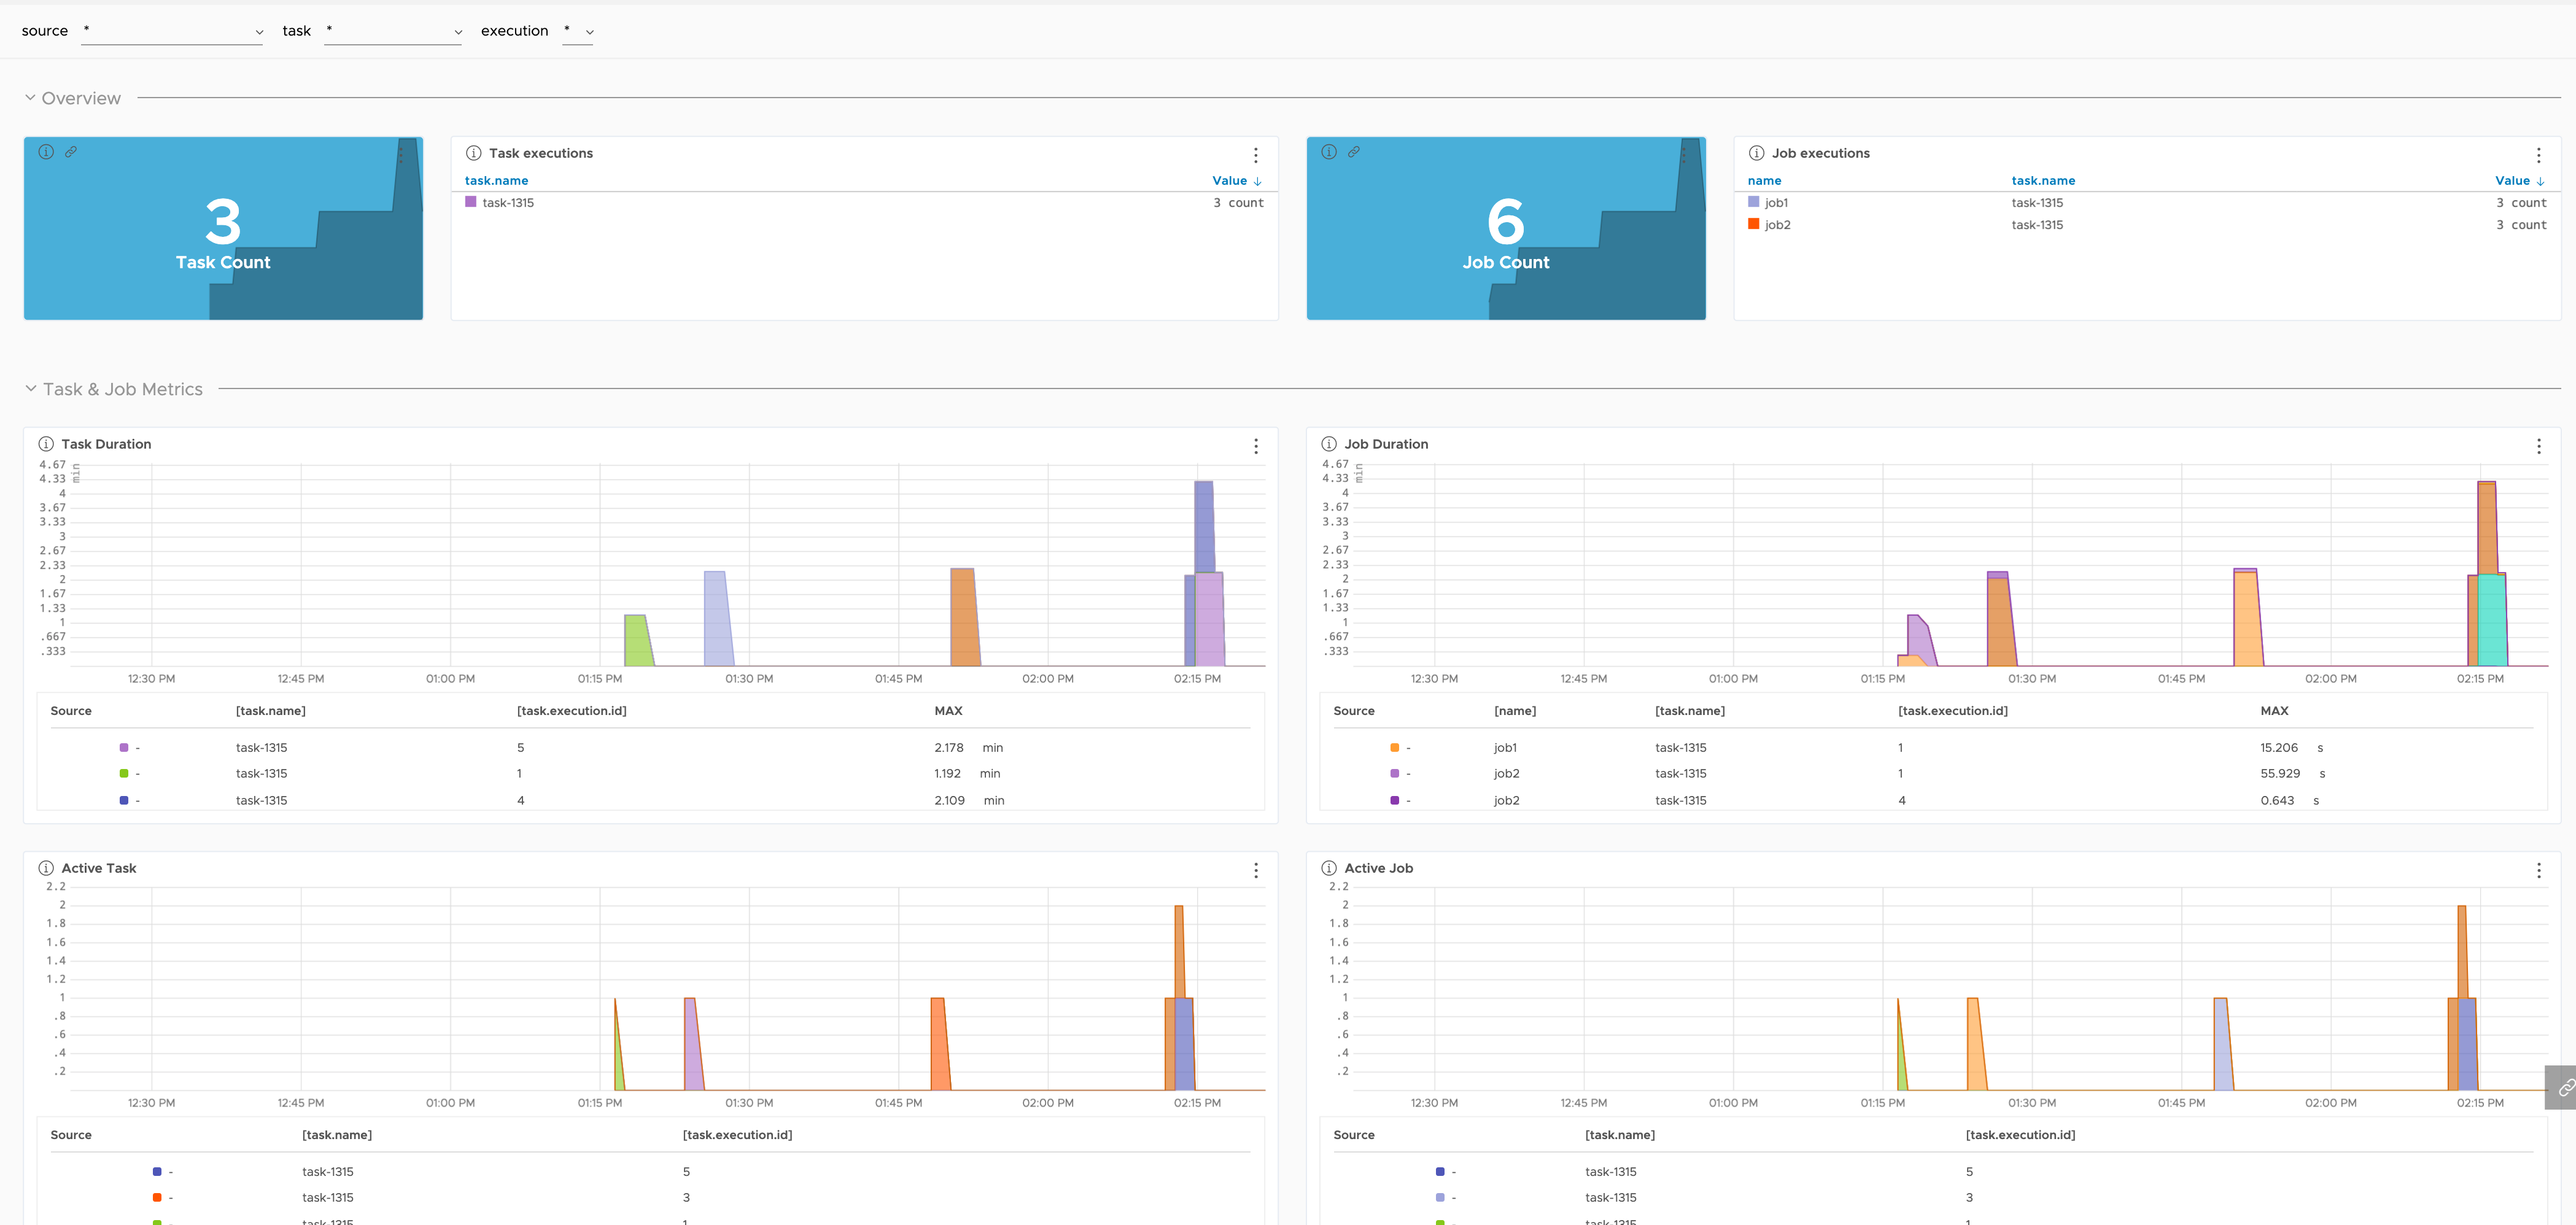
Here’s a preview of the Spring Cloud Data Flow Task applications dashboard:
Spring Cloud Data Flow Metrics
Spring Cloud Data Flow’s generic performance metrics are based on Micrometer, and are registered in Micrometer’s registry with the spring.cloud.dataflow prefix.
The following table explains all the metrics in details:
Auto-configuration enables the instrumentation of requests handled by Spring MVC. When management.metrics.web.server.request.autotime.enabled is true, this instrumentation occurs for all requests.
| Metric Name | Description |
|---|---|
| spring.cloud.dataflow.server.* | Metrics for all requests handled by SCDF’s Spring MVC application. Statistics: avg, count, max, sum. |
Spring Integration Metrics
Spring Integration Metrics Documentation
Spring Integration registers micrometer timers for each MessageHandler and MessageChannel and a counter for each MessageSource.
All metrics provided by the framework are registered in Micrometer’s global registry under the spring.integration prefix.
The following table explains all the metrics in details:
| Metric Name | Description |
|---|---|
| spring.integration.receive (type=source) | Message sources messages received. |
| spring.integration.receive (type=channel) | Messages received on pollable message channels. |
| spring.integration.send (type=handler) | Message handlers’ send processing time. |
| spring.integration.send (type=channel) | Message channels’ send processing time. |
| spring.integration.channels | Number of MessageChannels in the application. |
| spring.integration.handlers | Number of MessageHandlers in the application. |
| spring.integration.sources | Number of MessageSources in the application. |
Kafka Client Metrics
Applicable for all Spring Cloud Stream (SCS) applications configured with Kafka binder. The Spring Kafka framework, used internally by SCS, provides micrometer Kafka Client metrics. Later expose Apache Kafka native Producers, Consumers and Streams metrics.
Kafka Records
The Record stand for a single Message exchanged between the Producer and the Consumer applications using the Kafka Brokers.
| Metric Name | Description |
|---|---|
| kafka.producer.record.send.rate | The average number of records sent per second for a topic. |
| kafka.consumer.fetch.manager.records.consumed.rate | Average number of records consumed per second for a specific topic or across all topics. |
| kafka.producer.record.size.* | Size of the records sent per second for a topic: avg, max. |
| kafka.producer.record.error.rate | Average record sends per second that result in errors. |
| kafka.producer.record.retry.rate | Average number of re-tried record sends per-second. |
| kafka_consumer.fetch.manager.records.lag.* | Number of messages consumer is behind producer, either for a specific partition or across all partitions on this client: avg, max. |
Kafka Producer
Producers’ send request represents a single interaction between a Producer application and Kafka Broker. To exchange one Record (e.g. message) usually, multiple requests are performed between the producer and the brokers.
| Metric Name | Description |
|---|---|
| kafka.producer.request.rate | The average number of requests sent per second to the broker. |
| kafka.producer.response.rate | The average number of responses received per second. |
| kafka.producer.request.latency.* | The request latency in ms: avg, max. |
| kafka.producer.io.wait.time.ns.avg | The average length of time the I/O thread spent waiting for a socket ready for reads or writes in nanoseconds. |
| kafka.producer.io.wait.ratio | The fraction of time the I/O thread spent waiting. |
| kafka.producer.network.io.rate | The average number per second of network operations, reads or writes, on all connections. |
| kafka.producer.compression.rate.avg | The ratio of data compression in the batches of data the producer sends to the broker. A higher compression rate indicates greater efficiency. |
| kafka.producer.batch.size.avg | Average number of bytes sent per partition per request (e.g. data size send to different partition on the topic). |
| kafka.producer.outgoing.byte.rate | The average number of outgoing bytes sent per second to all servers - e.g. the producer network throughput. |
| kafka.producer.requests.in.flight | Current number of outstanding requests awaiting a response. |
| kafka.spring.cloud.stream.binder.kafka.offsetproducer.waiting.threads | Number of user threads blocked waiting for buffer memory to enqueue their records. |
Kafka Consumer
Consumer fetch request represents a single interaction between a Kafka Broker and a Consumer application. Retrieving a single Record (e.g. message) may involve multiple fetch requests.
| Metric Name | Description |
|---|---|
| kafka.consumer.fetch.manager.fetch.rate | Number of fetch requests per second from the consumer. |
| kafka.consumer.fetch.manager.fetch.latency.* | Time taken for any fetch request: avg, max. |
| kafka.consumer.fetch.manager.bytes.consumed.rate | Average number of bytes consumed per second for a specific topic or across all topics. |
Kafka Stream - Thread
| Metric Name | Description |
|---|---|
| kafka.stream.thread.[commit or poll or process or punctuate].rate | The average number of respective operations per second across all tasks. |
| kafka.stream.thread.[commit or poll or process or punctuate].latency.avg | The average execution time in ms, for the respective operation, across all running tasks of this thread. |
| kafka.stream.thread.task.created.rate | The average number of newly created tasks per second. |
| kafka.stream.thread.task.closed.rate | The average number of tasks closed per second. |
Kafka Stream - Task & Process Node
The metrics are only available if the recording level (e.g. metrics.recording.level configuration option) is set to debug.
| Metric Name | Description |
|---|---|
| kafka.stream.task.[commit or process].rate | The average number of respective operations per second across all tasks. |
| kafka.stream.task.[commit or process].latency.avg | The average execution time in ns, for the respective operation for this task. |
| kafka.stream.task.dropped.records.rate | The average number of records dropped within this task. |
| kafka.stream.task.record.lateness.* | The observed lateness (stream time - record timestamp) for this task: avg, max. |
| kafka.stream.task.enforced.processing.rate | The average number of enforced processings per second for this task. |
| kafka.stream.processor.node.process.rate | The average number of records processed per second by a source node. |
Spring Batch Metrics
Spring Batch Metrics Documentation
Spring Batch provides support for monitoring batch jobs using Micrometer.
All metrics provided by the framework are registered in Micrometer’s global registry under the spring.batch prefix.
The following table explains all the metrics in details:
| Metric Name | Description |
|---|---|
| spring.batch.job (tags: name, status) | Duration of job execution. |
| spring.batch.job.active | Currently active jobs. |
| spring.batch.step (tags: job.name, name, status) | Duration of step execution. |
| spring.batch.item.read (tags: job.name, step.name, status) | Duration of item reading. |
| spring.batch.item.process (tags: job.name, step.name, status) | Duration of item processing. |
| spring.batch.chunk.write | Duration of chunk writing. |
Spring Cloud Task Metrics
Spring Cloud Task Monitoring Documentation
Spring Cloud Task provides support for monitoring batch jobs and short-lived task applications using Micrometer.
All metrics provided by the framework are registered in Micrometer’s global registry under the spring.cloud.task prefix.
The following table explains all the metrics in details:
| Metric Name | Description |
|---|---|
| spring.cloud.task | Duration of Task execution. |
| spring.cloud.task.active | Records the run-time status of long-time lasting tasks. |
Spring Boot Metrics
Spring Boot Metrics Documentation
Spring Boot registers the following core metrics when applicable:
JVM metrics
Reports metrics for memory and buffer pools, garbage collection statistics, threads utilization, class loaders.
| Metric Name | Description |
|---|---|
| jvm.buffer.count | Number of buffer pools. |
| jvm.buffer.memory.used | Used buffer pools memory. |
| jvm.buffer.total.capacity | Buffer pools total capacity. |
| jvm.classes.loaded | Number of classes loaded. |
| jvm.classes.unloaded | Number of classes unloaded. |
| jvm.gc.live.data.size | The live data size is the size (in bytes) of the old generation after a major garbage collection. |
| jvm.gc.max.data.size | The maximum size of long-lived heap memory pool for the old generation (in bytes). |
| jvm.gc.memory.allocated | Increase in the size of the young heap memory pool after one garbage collection and before the next. |
| jvm.gc.memory.promoted | Count of positive increases in the size of the old generation memory pool from before garbage collection to after garbage collection. |
| jvm.gc.pause.* | Garbage collection pauses Statistics: avg, count, max, sum. |
| jvm.memory.committed | JVM committed memory. |
| jvm.memory.max | JMV max available memory. |
| jvm.memory.used | JMV used available memory. |
| jvm.threads.daemon | Current number of live daemon threads in this JVM. |
| jvm.threads.live | Current number of live threads in this JVM. |
| jvm.threads.peak | The peak number of threads in this JVM. |
| jvm.threads.states | Reports threads states. |
CPU metrics
| Metric Name | Description |
|---|---|
| process.cpu.usage | Percentage of CPU usage. |
File descriptor metrics
| Metric Name | Description |
|---|---|
| process.files.max | Maximum allowed file descriptors count. |
| process.files.open | Open file descriptors count. |
Log4j2 and Logback metrics
Records the number of events logged to Log4j2 and Logback at each level.
| Metric Name | Description |
|---|---|
| logback.events | Number of events logged to Log4j2 and Logback at each level. |
Uptime metrics
Reports a gauge for uptime and a fixed gauge representing the application’s absolute start time.
| Metric Name | Description |
|---|---|
| process.start.time | Fixed gauge representing the application’s absolute start time. |
| process.uptime | Gauge representing the application’s uptime. |
Spring MVC Metrics
Auto-configuration enables the instrumentation of requests handled by Spring MVC Metrics.
When management.metrics.web.server.request.autotime.enabled is true, this instrumentation occurs for all requests.
| Metric Name | Description |
|---|---|
| http.server.requests.* | Statistics: avg, count, max, sum. |
Tomcat metrics
The server.tomcat.mbeanregistry.enabled must be set to true for all Tomcat metrics to be registered.
| Metric Name | Description |
|---|---|
| tomcat.sessions.active.current | Number of Tomcat active sessions. |
| tomcat.sessions.active.max | Maximum number of active Tomcat sessions. |
| tomcat.sessions.alive.max | Duration of the maximum Tomcat active sessions. |
| tomcat.sessions.created | Number of sessions created by Tomcat. |
| tomcat.sessions.expired | Number of expired Tomcat sessions. |
| tomcat.sessions.rejected | Number of sessions rejected after exceeding the maximum session configuration. |