Summary
flapping(<timeWindow>, <tsExpression>)
Returns the number of times a counter has reset within the specified time window.
Parameters
| Parameter | Description |
|---|---|
| timeWindow | Amount of time in the moving time window. You can specify a time measurement based on the clock or calendar (1s, 1m, 1h, 1d, 1w), the window length (1vw) of the chart, or the bucket size (1bw) of the chart. Default is minutes if the unit is not specified. |
| tsExpression | Expression that describes the time series you want the number of counter resets for. |
Description
The flapping() function reports how often a time series falls and then climbs within a specified time window. You can use this function to see whether a service is flapping, that is, whether there are great fluctuations.
You typically use flapping() with counter metrics to determine how often a counter reset has occurred over a moving time window. For example, flapping(10m, ts(my.metric)) returns, at each point, the number of counter resets over the previous 10 minutes within each specified time series.
Although you can apply flapping() to any kind of metric, the typical use is to analyze the behavior of counter metrics, which are metrics that report cumulative totals (increasing values) over time. A counter metric normally produces an monotonically increasing series of data values. However, a metric might reset its counter on occasion – for example, if the metric’s source restarts or encounters a particular condition. A metric indicates a counter reset by reporting one or more falling data values, followed by rising data values. flapping() reports the number of such resets within the specified time window.
Example
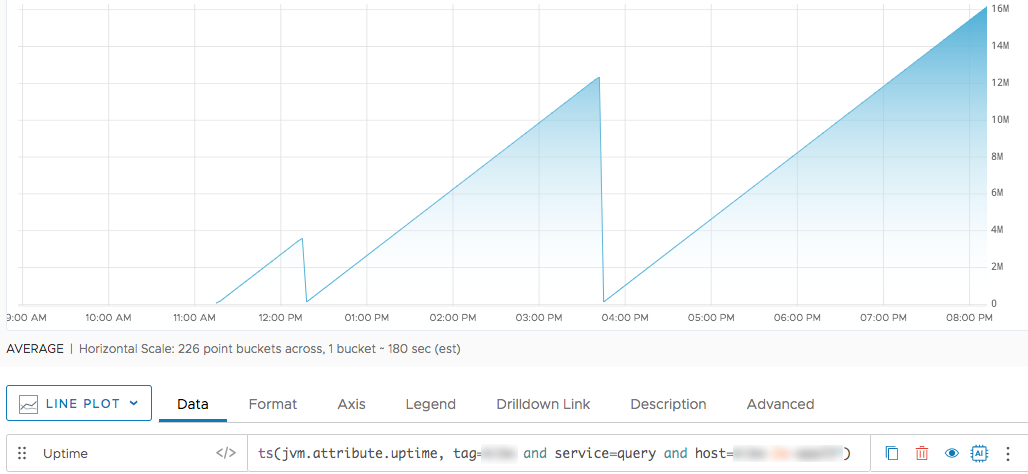
The following screenshort shows a counter metric that monitors uptime.

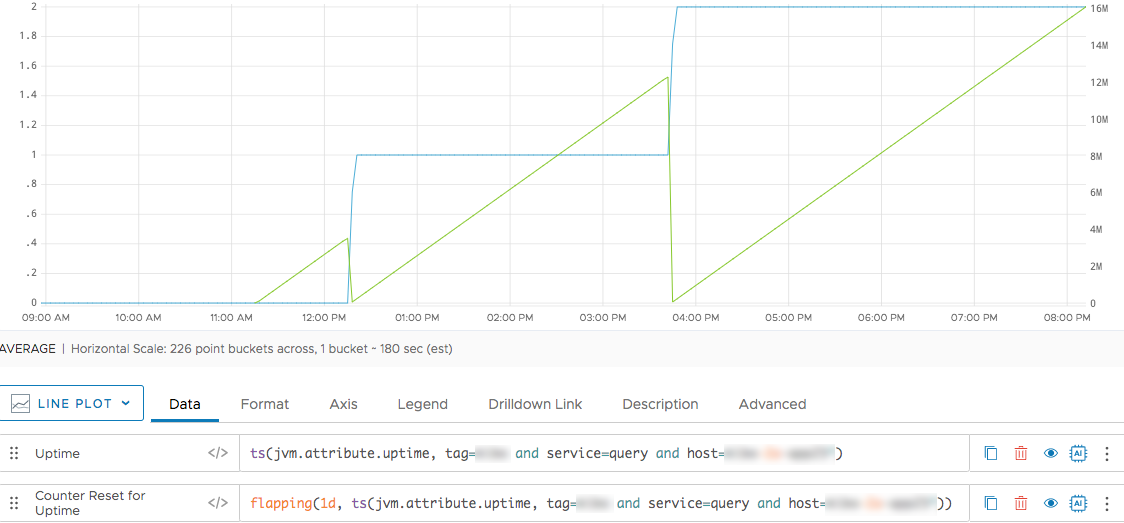
We can use flapping() to show that counter reset twice (blue line and axis on the left).

See Also
The [mchanges() function](ts_mchanges.html) reports how often a time series value changes within a specified moving time window.