Summary
ts(<metricName> [and|or [not] <metricName2>] ...
  [,|and|or [not] source="<sourceName>"] ...
  [and|or [not] tag="<sourceTag>"] ...
  [and|or [not] <pointTagKey>="<pointTagValue>"] ...)
Returns the time series that match the specified metric name, optionally filtered by sources and point tags.
Use ts() to display the time series in a time-series chart, or to specify the series to other functions.
Parameters
| Parameter | Description |
|---|---|
| <metricName> | Name of a metric that describes one or more time series. Specify multiple metric names by including wildcards or by combining multiple names with Boolean operators. Examples:
cpu.load.metric
cpu.*.metric
cpu.load.metric or cpu.idle.metric
|
| source="<sourceName>" | Source of the time series to be returned. Time series from any other sources are filtered out of the result set. Specify any number of sources by combining them with Boolean operators. Omit this parameter to return metricName series from all sources. Examples:
source="appServer15"
source="app-1*"
source="app-10" or source="app-20"
|
| tag="<sourceTagName>" | Source tag that designates the sources of the time series to be returned. Series from any sources without the source tag are filtered out of the result set. Specify any number of source tags by combining them with Boolean operators. Omit this parameter to ignore source tags. Examples:
tag="appServers"
tag="env.cluster.role.*"
tag="appServer" and tag="local"
|
| <pointTagKey>="<pointTagValue>" | Point tag key and value that are associated with the time series to be returned. Series without the specified key-value pair are filtered out of the result set. Specify any number of point tags by combining them with Boolean operators. Omit this parameter to ignore point tags. Examples:
region="us-west-2a"
region="us-west*"
region="us-west-2a" or region="us-west-2b"
|
Description
The ts() function returns one or more time series. A time series is a sequence of data points that each consists of a data value and a timestamp. Every time series is identified by a unique combination of metric name, source name, and point tag values.
You visualize a time series by running ts() as a top-level query in Query Editor under a time-series chart.
You can also use ts() as an input tsExpression that you specify to another query function, for example, msum(10m, ts(~sample.disk.bytes.written, source="app-14"))
The ts() function uses the specified parameters to select the time series to return:
-
Specify just the metric name to return all time series that match the name. For example, the following function returns all time series for
~sample.disk.bytes.written, which might be reported from multiple sources and have any number of point tags associated with them:ts(~sample.disk.bytes.written) -
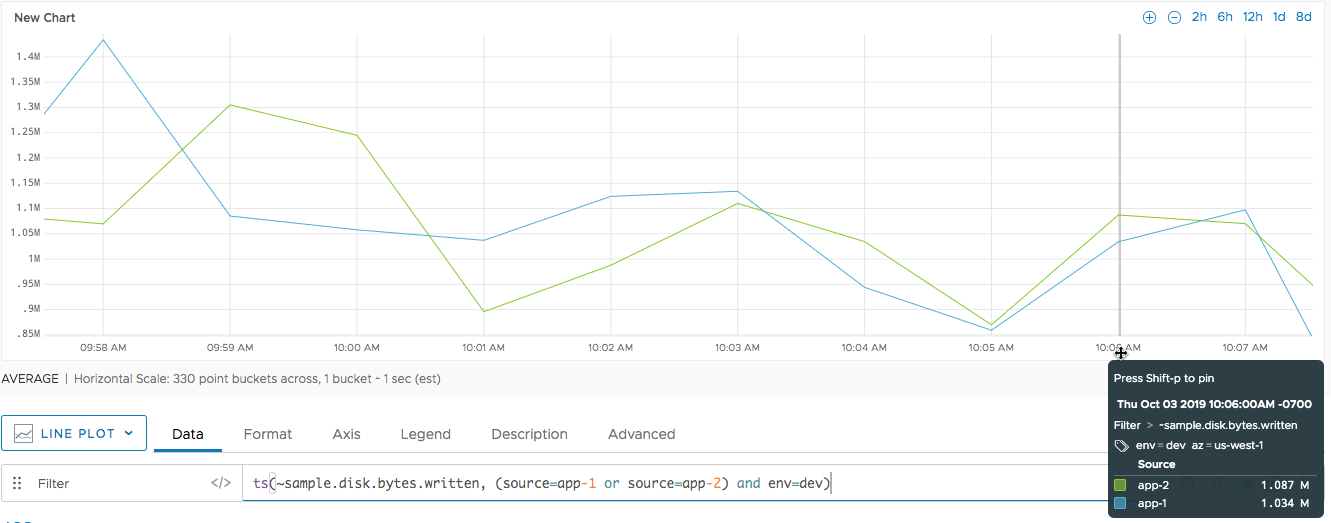
Filter the matched time series by specifying a combination of source names, source tags, and/or point tags. For example, the following function returns only the time series that are from either of 2 specified sources and that have an
envpoint tag with the valuedev:ts(~sample.disk.bytes.written, (source="app-1" or source="app-2") and env="dev")
Note: As you type a ts() function in Query Editor, you are prompted with metric name components, Boolean operators, keywords, and possible values.
A time series described by a ts() function may be discrete or continuous, depending on how frequently and regularly the data points are reported.
Examples
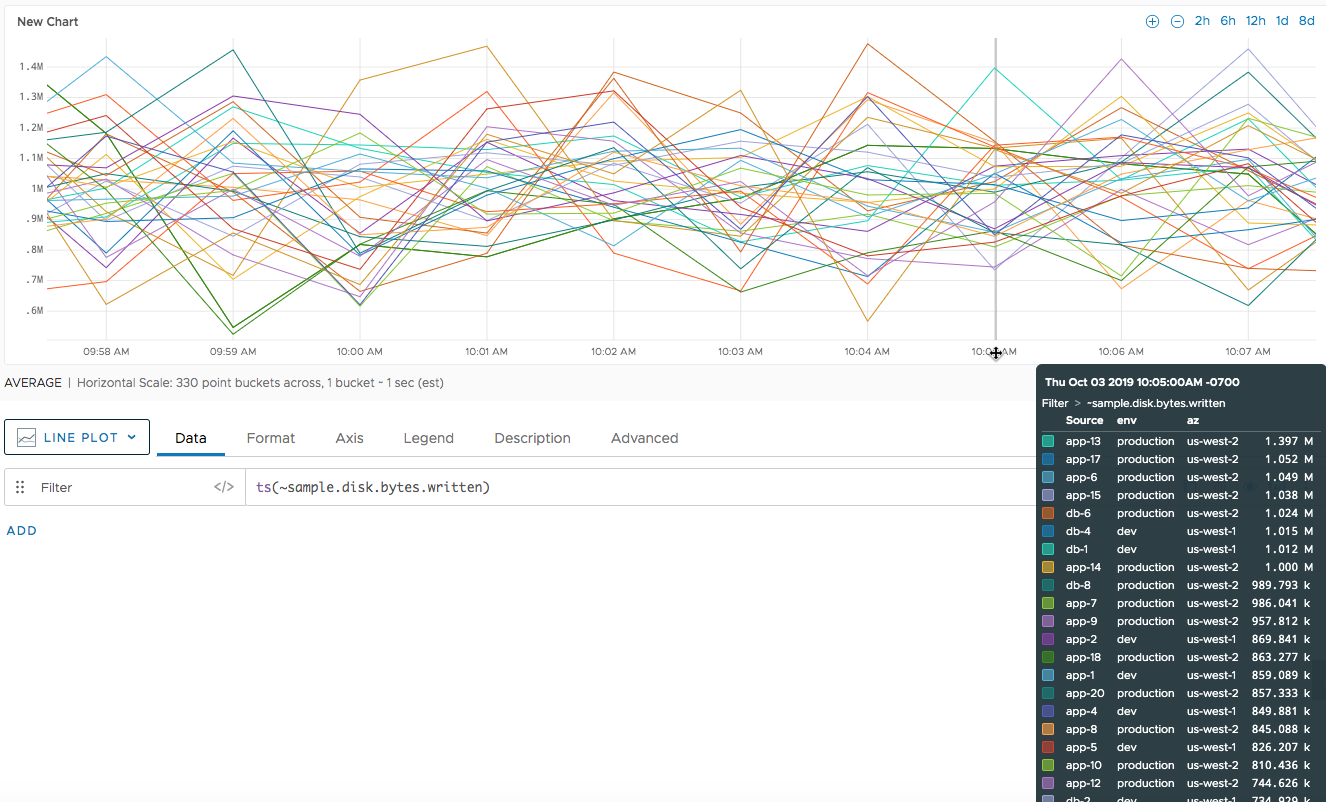
The following chart shows the results of running ts() as a top-level query. Because we include just the metric name ~sample.disk.bytes.written, the query returns all time series reported with that metric name.

We can add filters to narrow down the results. The following chart shows that two time series match the specified sources and point tag:
