Summary
mavg(<timeWindow>, <tsExpression>)
Returns the moving average of each time series over the specified time window.
Parameters
| Parameter | Description |
|---|---|
| timeWindow | Amount of time in the moving time window. You can specify a time measurement based on the clock or calendar (1s, 1m, 1h, 1d, 1w), the window length (1vw) of the chart, or the bucket size (1bw) of the chart. Default is minutes if the unit is not specified. |
| tsExpression | Expression that describes the time series you want moving averages for. |
Description
The mavg() function computes the moving average of each time series over a shifting time window. For example, mavg(60m, ts(my.metric)) returns, at each point, the average of the data values over the previous 60 minutes for each specified time series.
Here’s how to select your averaging function:
- Use
mavg()to see the moving average in a specified time window. - Use
avg()to see the average (the mean). - Use
mmedian()to see the median. Usingmmedian()is preferred if there are a lot of outliers. - Use
mpercentile()with a percentile of 50 to see the moving median.
Example
Let’s say you have the following expression:
mavg(48h, ts(my.metric))
Assume ts(my.metric) reports data values once per hour, but only started reporting data 24 hours ago. mavg() will add up all reported points within the last 48 hours and divide by the number of reported points (not number of hours). So in that example mavg() divides by 24 not by 48, because technically, we have only 24 reported points within the last 48 hours.
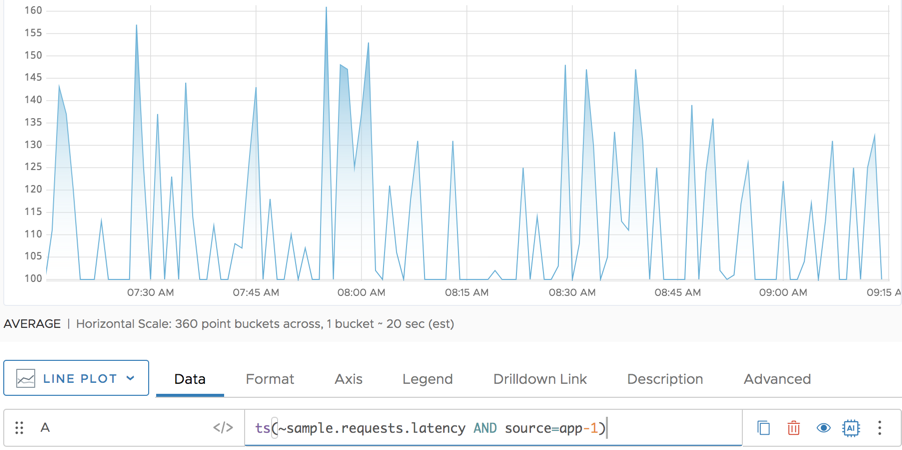
The following example shows the requests latency for a single app server (app-1):

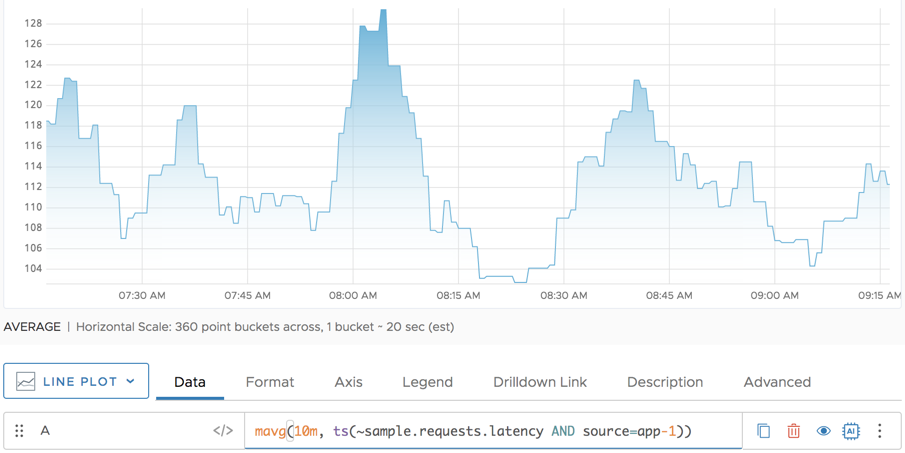
And here’s what we see when we apply mavg().

Caveats
At times, using msum() can get you the information you want. In that case, use msum() because performance is better.