Summary
mdiff(<timeWindow>, <tsExpression>)
Returns the moving difference between data values reported timeWindow apart, within each time series described by the expression.
Parameters
| Parameter | Description |
|---|---|
| timeWindow | Amount of time in the moving time window. You can specify a time measurement based on the clock or calendar (1s, 1m, 1h, 1d, 1w), the window length (1vw) of the chart, or the bucket size (1bw) of the chart. Default is minutes if the unit is not specified. |
| tsExpression | Expression describing the time series you want moving differences for. |
Description
The mdiff() function returns the moving difference for each time series described by the expression.
The moving difference for a time series is the difference, at each point in time, between the currently reported data value, and the data value that was reported timeWindow ago. For example, mdiff(10m, ts(my.metric)) returns, at each point, the result of subtracting the data value reported 10 minutes ago from the current data value, for each specified time series.
This function does not interpolate any data values before doing the subtraction.
Examples
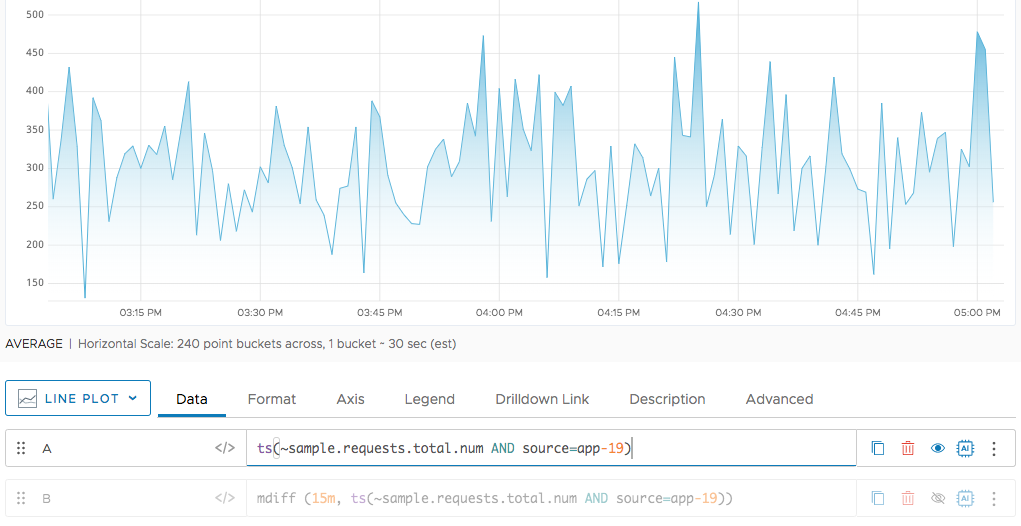
In this example, we’re starting with a single time series.

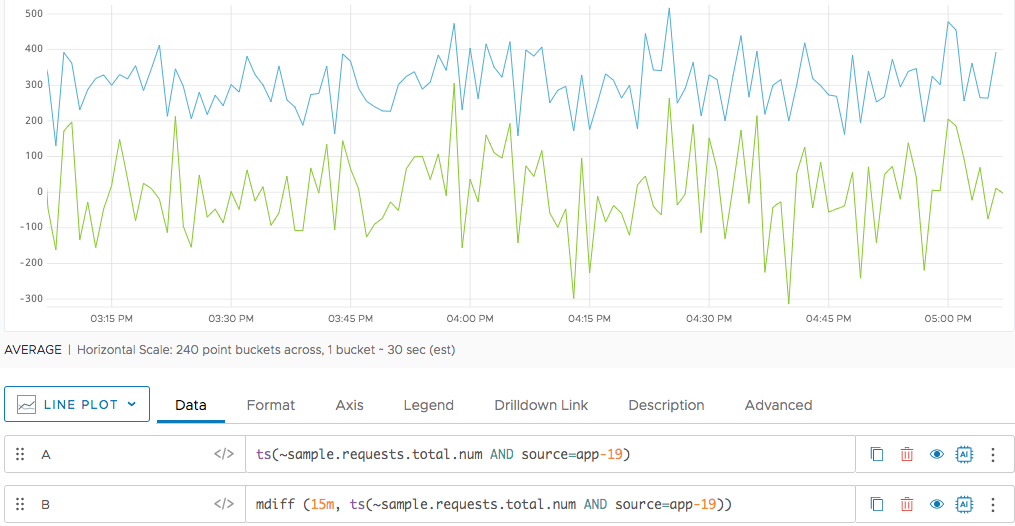
In the following chart, each point in the green time series represents the current value minus the value 15 minutes ago.

See Also
See Using Moving and Tumbling Windows to Highlight Trends for background information.