Summary
time()
Returns a continuous series of epoch seconds corresponding to the seconds on the chart’s x-axis.
Description
The time() standard time function represents each second on the chart’s x-axis as a number of epoch seconds. The returned values are based on the system clock on the product instance.
Epoch seconds are the number of seconds that have elapsed since 00:00:00 Coordinated Universal Time (UTC) on January 1, 1970. By default, the chart legend displays an abbreviated version of the epoch seconds that represent the timestamp. You can cause the legend to display the entire number of epoch seconds by holding down the shift key when you hover over the time series.
Note that if the chart’s bucket size is greater than 1 second, some of the displayed values will be averages over multiple epoch time values, and therefore shown as decimal numbers with fractional parts. To get precise epoch times, you can zoom in to shrink the chart’s bucket size to ~1 second.
Examples
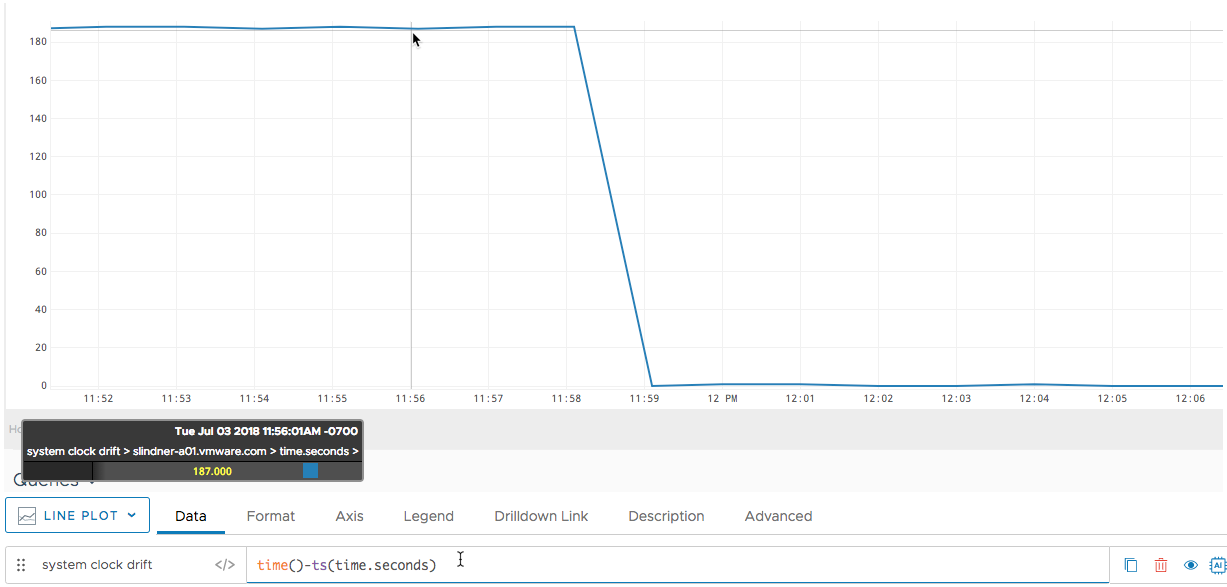
You can monitor the system clock of a source if it has a metric for sending its system time to our service as epoch seconds. By comparing such a metric to the results of time(), you can detect latency or system clock drift. The following chart shows the results of time()-ts(time.seconds), which is the difference between the time maintained by the product instance and a source’s system clock (time.seconds). Notice that this difference is positive 187 seconds up to 11:59am, which means the service time is ahead of the source’s time by a little over 3 minutes. At 12 noon, the two clocks are synchronized again.

The time.seconds metric in this example can be created for Macintosh and Linux hosts via direct data ingestion. You can set up a cron job to generate and send data points directly to our service, where each point has the metric name time.seconds and a value produced by the host’s date utility. After opening your cron table for editing (crontab -e), enter:
* * * * * echo "time.seconds $(date +\%s) source=$(hostname)" | curl -H "Authorization: Bearer <TOKEN>" --data @- https://mydomain.wavefront.com/report
You’ll need to supply your own API token and domain, as described in Direct Ingestion Example Commands.